North Carolina at a Demographic Crossroad:
Loss of Lives and the Impact
White Paper by James H. Johnson Jr., Ph.D, Jeanne Milliken Bonds, MPA
Kenan-Flagler Business School UNC-Chapel Hill
Allan M. Parnel Vice President, Cedar Grove Institute for Sustainable Communities Mebane, NC
September, 2023
ABSTRACT
North Carolina’s phenomenal migration-driven population growth masks a troubling trend: high rates of death and dying prematurely which, left unchecked, can potentially derail the state’s economic growth and prosperity in the years ahead. On average, 246 North Carolinians died each day during the 2010s, increasing to 317 daily between April 1, 2020 and July 1, 2022. COVID-19 and the substance abuse crisis have played a major role in premature deaths of prime working age citizens of the state. Both people-based and place-based strategies and interventions are urgently needed to address the state’s death crisis.
Critical Background & Context
North Carolina is one of the nation’s most attractive migration destinations (Johnson, Bonds, & Parnell, 2021a; Johnson, Parnell, and Bonds, 2024). As a result of a near decade-long average of 150 newcomers daily, the state’s population increased more rapidly (9.5%) between 2010 and 2020 than the nation’s population (7.4%). And since 2020, North Carolina has replaced Arizona as the nation’s third most popular migration destination after Florida and Texas.
During a 27-month period encompassing the COVID-19 pandemic-induced shutdown of the nation’s economy (April 1, 2020 – July 1, 2022), North Carolina received on average 307 transplants each day, according to Census Bureau population estimates and components of change statistics. New York, New Jersey, and Massachusetts in the Northeast; Ohio, Michigan, and Illinois in the Midwest; and California in the West were major contributors of those moving to North Carolina (Johnson, Parnell, & Bonds, 2024; also see, Figure 1).


Moving from Concentrated to Dispersed Growth
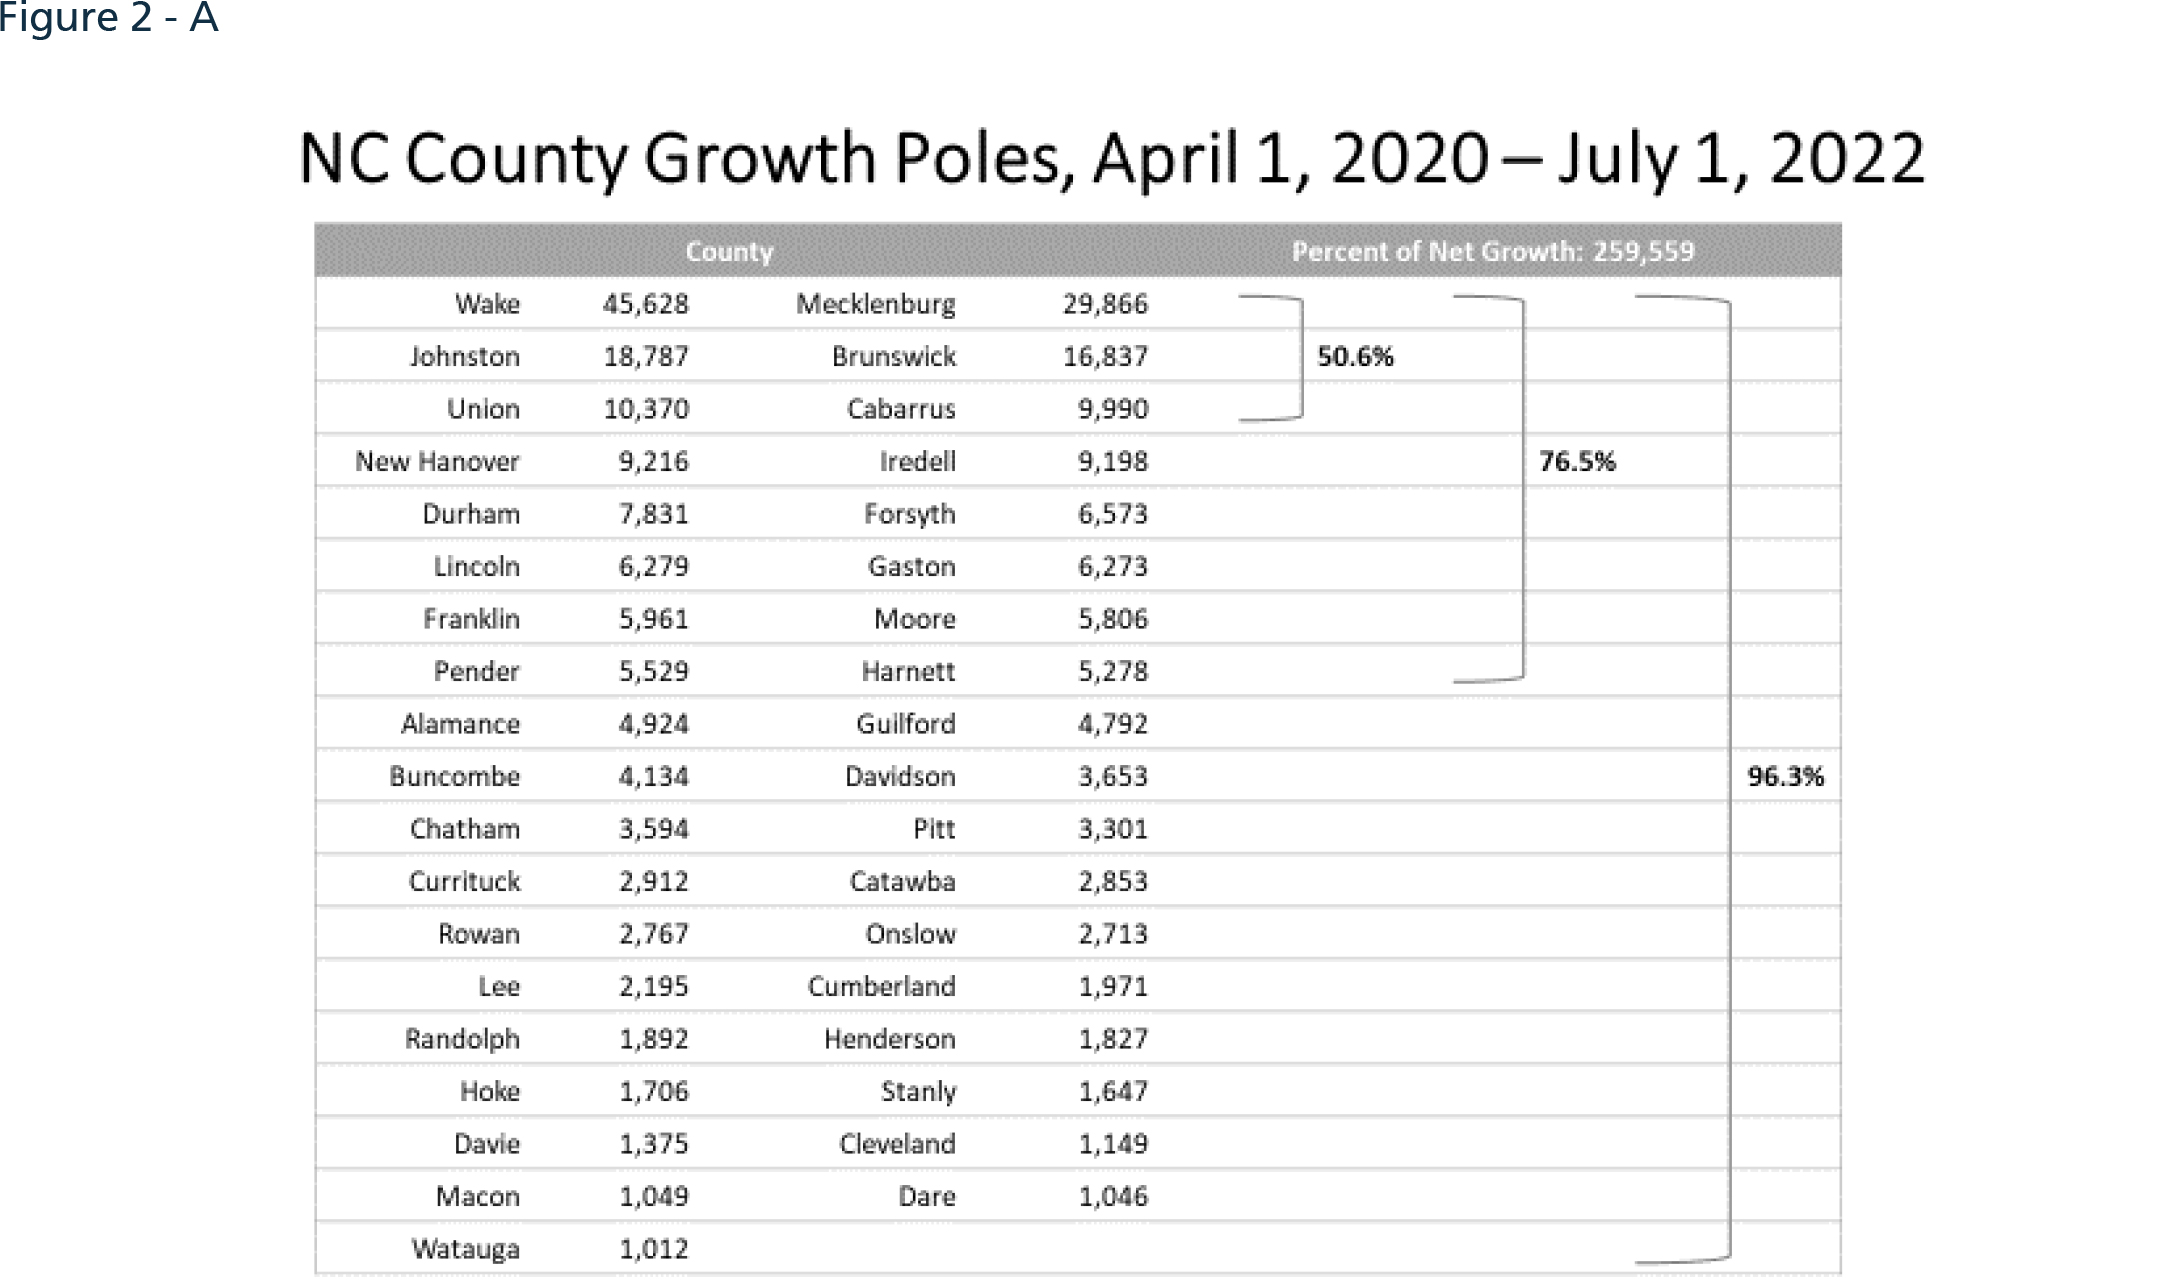
Between 2010 and 2020, North Carolina’s migration induced population growth was highly concentrated (Figure 2A). Two counties—Wake and Mecklenburg—captured roughly half of net growth. Cumulatively, ninety-five percent of the growth was concentrated in 15 counties—mainly centers of government, commerce, and research and development along the I-40/I-85 corridor and amenity rich communities on the coast, in the mountains, and within commuting distance of the major centers of higher education, health care, and innovation (Johnson, Bonds, & Parnell, 2022). In contrast to the fifteen rapidly growing counties, the remaining eighty-five, mostly rural counties experienced slow growth, no growth, or population decline in the last decade.


With the massive influx of COVID-19 pandemic refugees between April 2020 and July 2022 (Johnson, 2021a,b), most of the state’s recent net population growth (96%) has been dispersed across a broader set of 37 North Carolina counties (Figure 2B). As newcomers drove up both demand and the cost of housing in the 15 traditional growth markets, growth spilled over the boundaries of these counties into 22 mostly adjacent and nearby counties where residential developers aggressively built new housing and communities to accommodate demand (Figure 3).1 We should note that, in these newly emergent population growth magnet counties, which had experienced slow growth, no growth, or population decline prior to the pandemic, demand was driven not only by transplants moving to the state, but also existing North Carolina residents who were priced out housing markets in the state’s 15 traditional growth centers.

Browning and Greying
Between April 2020 and July 2022, the race and ethnic as well as age composition of North Carolina’s population changed dramatically (Table 2). Collectively, people of color—Asians, Blacks, Hispanics, Mixed-Race, Native Americans, and Pacific Islanders—accounted for nearly three-quarters the state’s growth (70%). Hispanics drove absolute growth (81,488) while Asians (9.9%) and people self-identifying as mixed-race (9.1%) experienced the most rapid rates of growth—far exceeding the state’s overall rate of growth (2.5%) during this period. Increasing by only 2 percent (77,000), non-Hispanic whites accounted for less than one-third of the state’s absolute growth (259,000) between April 2020 and July 2022, extending a trend defined elsewhere as the “browning” of the state’s population (Johnson, Farrell, & Guinn, 1997; Johnson and Parnell, 2019).

Simultaneous with becoming more racially and ethnically diverse, North Carolina’s population also was aging—a trend popularly characterized as the “greying” of the state (Johnson and Parnell, 2019; Johnson, Parnell & Bonds, 2024). Increasing by 7.2 percent, seniors aged 65 and older were the state’s most rapidly growing population between April 2020 and July 2022 (Table 3). Both the 18-64 and under age 18 populations increased at much slower rate—by 1.9 percent and 0.5 percent, respectively— and notably slower than the state’s overall rate of growth (2.5%). Part of a national trend, this shift in the state’s age structure reflects the combined effects of the progressive aging of the state’s baby boomer cohort (those born between 1946 and 1964), extended longevity among older adults, and the influx of aging and elderly newcomers—many whom are retirees (Johnson, 2016; Johnson, Parnell, & Lian, 2018). Premature deaths among North Carolina’s prime working age population, as we discuss below, is also contributing to the greying of the state’s population (Office of the Chief Medical Examiner, 2022).

A Cause for Concern
The influx of a more diverse set of newcomers, as we have shown elsewhere (Johnson, Bonds, & Parnell, 2022; Johnson, 2021b), has stimulated economic growth in the state, triggering residential, commercial, and industrial development as well as boosting consumer spending and tax revenues. Further, the state’s migration-induced demographic and economic dividends have further enhanced North Carolina’s image and reputation as an ideal place to live, work, play, and do business for prospective domestic and international migrants as well as corporate leaders (CNBC, 2022).
However, this pattern of phenomenal growth masks a troubling trend: high rates of death and dying prematurely, which, left unchecked, can potentially derail the state’s economic growth and prosperity in the years ahead. 3 Reflecting all causes of death, 24 North Carolinians died for every 1,000 residents of the state during the 27 months covered in the Census Bureau’s latest population estimates. However, looking across the state’s 100 counties (Figure 4), death rates ranged from a low of 13/1000 population in some counties to a high of more than 40/1000 population in other counties between April 2020 and July 2022.

Normal population aging partially explains the revealed patterns of deaths within the state. However, declining fertility is another factor (Tavernise, 2021; Kekkatos, 2019; Kwon, 2020; Stone, 2018). The total fertility rate has been below the replacement level—2.1 children per woman of childbearing age–in the U.S. since 2008 and in North Carolina since 2015 (Tavernise, et al, 2021; NCSCHS, n.d.). Owing to the combined effects of below replacement level fertility and an older population in rural areas, deaths exceeded births in 87 of North Carolina’s 100 counties between April 2020 and July 2022. Only 17 counties registered more births than deaths during this 27-month period (Figure 5).

Unfortunately, normal population aging and declining fertility are only part of the issue. The COVID-19 pandemic, which reportedly caused further declines in fertility (Tavernise, 2021; Rogers, 2021; Kearney & Levine, 2021a,b),4 and a substance abuse crisis also have strongly influenced the patterns of death and dying in North Carolina (Case & Deaton, 2020; Karma, 2020; Sabo & Johnson, 2022; NCDHHS, 2022; Johnson, Bonds, & Parnell, 2021b; Healy, 2019; Gold, 2020). In the last year alone, which was the tail end of the pandemic, there were 36 COVID-19 deaths per 100,000 population in the state. But, because of differential rates of exposure to the deadly coronavirus and vaccination hesitancy rates (Johnson, Bonds, & Parnell, 2021c), the incidence of COVID-19 deaths varied markedly across the state, ranging from 20-34 deaths per 100,000 population in thirty-eight counties to an unimaginable 75-115 deaths per 100,000 population in seven of the state’s counties. In between these extremes, COVID-19 death rates were moderate (35-49) to high (50-69) in the remaining fifty-five counties (Figure 6).

COVID-19 has taken the lives of 29,059 North Carolinians. Nearly a quarter (24% or 7,154) of these COVID causalities were working age individuals (18-64). Another age group that research shows are still actively engaged in the labor market (Leonesio, et al, 2012; Simons, 2020)–the so-called young old (aged 65-74)—also constituted nearly a quarter (23.6% or 6,855) of COVID-19 deaths. These two groups combined made up roughly half of all COVID deaths–a tragic loss of human capital sorely needed to propel the state’s economy and sustain social safety net systems (Table 4).

Making matters worse, the COVID-19 lockdown forced people struggling with drug addiction into isolation and constrained their access to in-person drug counseling and treatment (Jamison, 2021; Bernstein & Achenbach, 2021), which exacerbated the state’s drug overdose crisis (NCDHHS, 2022). North Carolina overdose deaths increased by 60 percent between 2019 (2,352 deaths) and 2021 (3,759 deaths). In addition, there was a 29 percent increase (3,596 cases) in overdose-related visits to hospital emergency departments between 2019 (12,115 cases) and 2021 (15,724 cases). Notably, the increase in overdose deaths would have been even greater were it not for a 40 percent increase in Naloxone reversals between 2019 (2,960) and 2021 (4,154)—restoring victims normal breathing by blocking the effects of opioids
In 2022 there were 3,761 drug overdose deaths in North Carolina, two more than in 2021 (3,759) and 1,409 more than in 2019 (2,352). For all North Carolinians, the overdose death rate was 35.9/100,000 population in 2022. However, among the state’s various race/ethnic groups, Native Americans had by far the highest drug overdose death rate (83.6) followed by whites (36.1) and Blacks (26.7). Hispanics (10.7) and Asians (4.6) had the lowest drug overdose deaths rates in 2022. In absolute numbers, Whites accounted for the largest share of the overdose deaths (2,424) — 64% of the total (3,761)— followed by Blacks (627), Hispanics (113), Native Americans (104), and Asians (17) (Table 5).

Between 2000 and 2020, according to the North Carolina Department of Health and Human Services (NCDHHS, 2022), “28,000 North Carolinians lost their lives to drug overdoses.” Our research shows there were 1,718 overdose deaths, roughly five per day, in North Carolina in 2018 (Johnson, 2021b).
Paralleling national trends, Office of the Chief Medical Examiner (2022) data confirm that overdose deaths in North Carolina have been concentrated disproportionately among males. In 2020, for example, males accounted for 2,360 of the 3,454 total causalities recorded (68 percent). Moreover, the male drug overdose death rate (45.8/100,000 population) was more than double the female drug overdose death rate (20/100,000 population). And among males, 88 percent of drug overdose deaths were concentrated among the prime working age demographic (25-64). Death rates were especially high among males aged 25-34 (95/100,000), 35-44 (98/100,000), and 45-54 (70/100,000). Notably, among males, close to ten percent of drug overdose deaths were concentrated among those aged 15-24—a key demographic that will have to propel the state’s economy forward in the years ahead (Table 6). Research presented elsewhere confirms that white males with less than a college education make up a disproportionate share of these drug overdose deaths (Case and Deaton, 2020)

Reflecting what might be characterized as manifestations of “geography of despair,” there were isolated pockets and high concentrations of not only overdose deaths, but also overdose hospital emergency department visits throughout the state in 2022. It is worth noting that, correspondingly, the incidence of these drug overdose deaths and hospital emergency department visits oftentimes was high in the same counties adversely affected by COVID-19 deaths (Figures 6 and 7).

Against the backdrop of these deaths of despair, concrete steps are urgently needed to nurture, support, and protect North Carolina’s human capital base, including both homegrown and imported talent, which unquestionably is the state’s most valuable resource (Office of State Budget and Management 2023; Brown, 2023). Further unraveling the complexity of how the state is changing demographically, we believe, is critically important for strategy development to address the problem.
A Cause for Concern
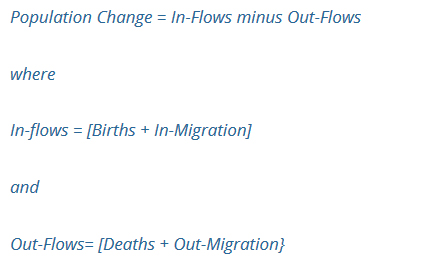
To specifically “see” where the problem lies within the state at a more granular level and to provide context for strategy development, we build upon and expand our prior research by applying the Balance of Population Change equation to the Census Bureau’s North Carolina county level population change estimates and components of change statistics for the 27 months between April 1, 2020-July 1, 2022 (see Johnson, Parnell, & Bonds, 2024).
Descriptively, the equation stipulates that for any geographic area over a specified timeframe:

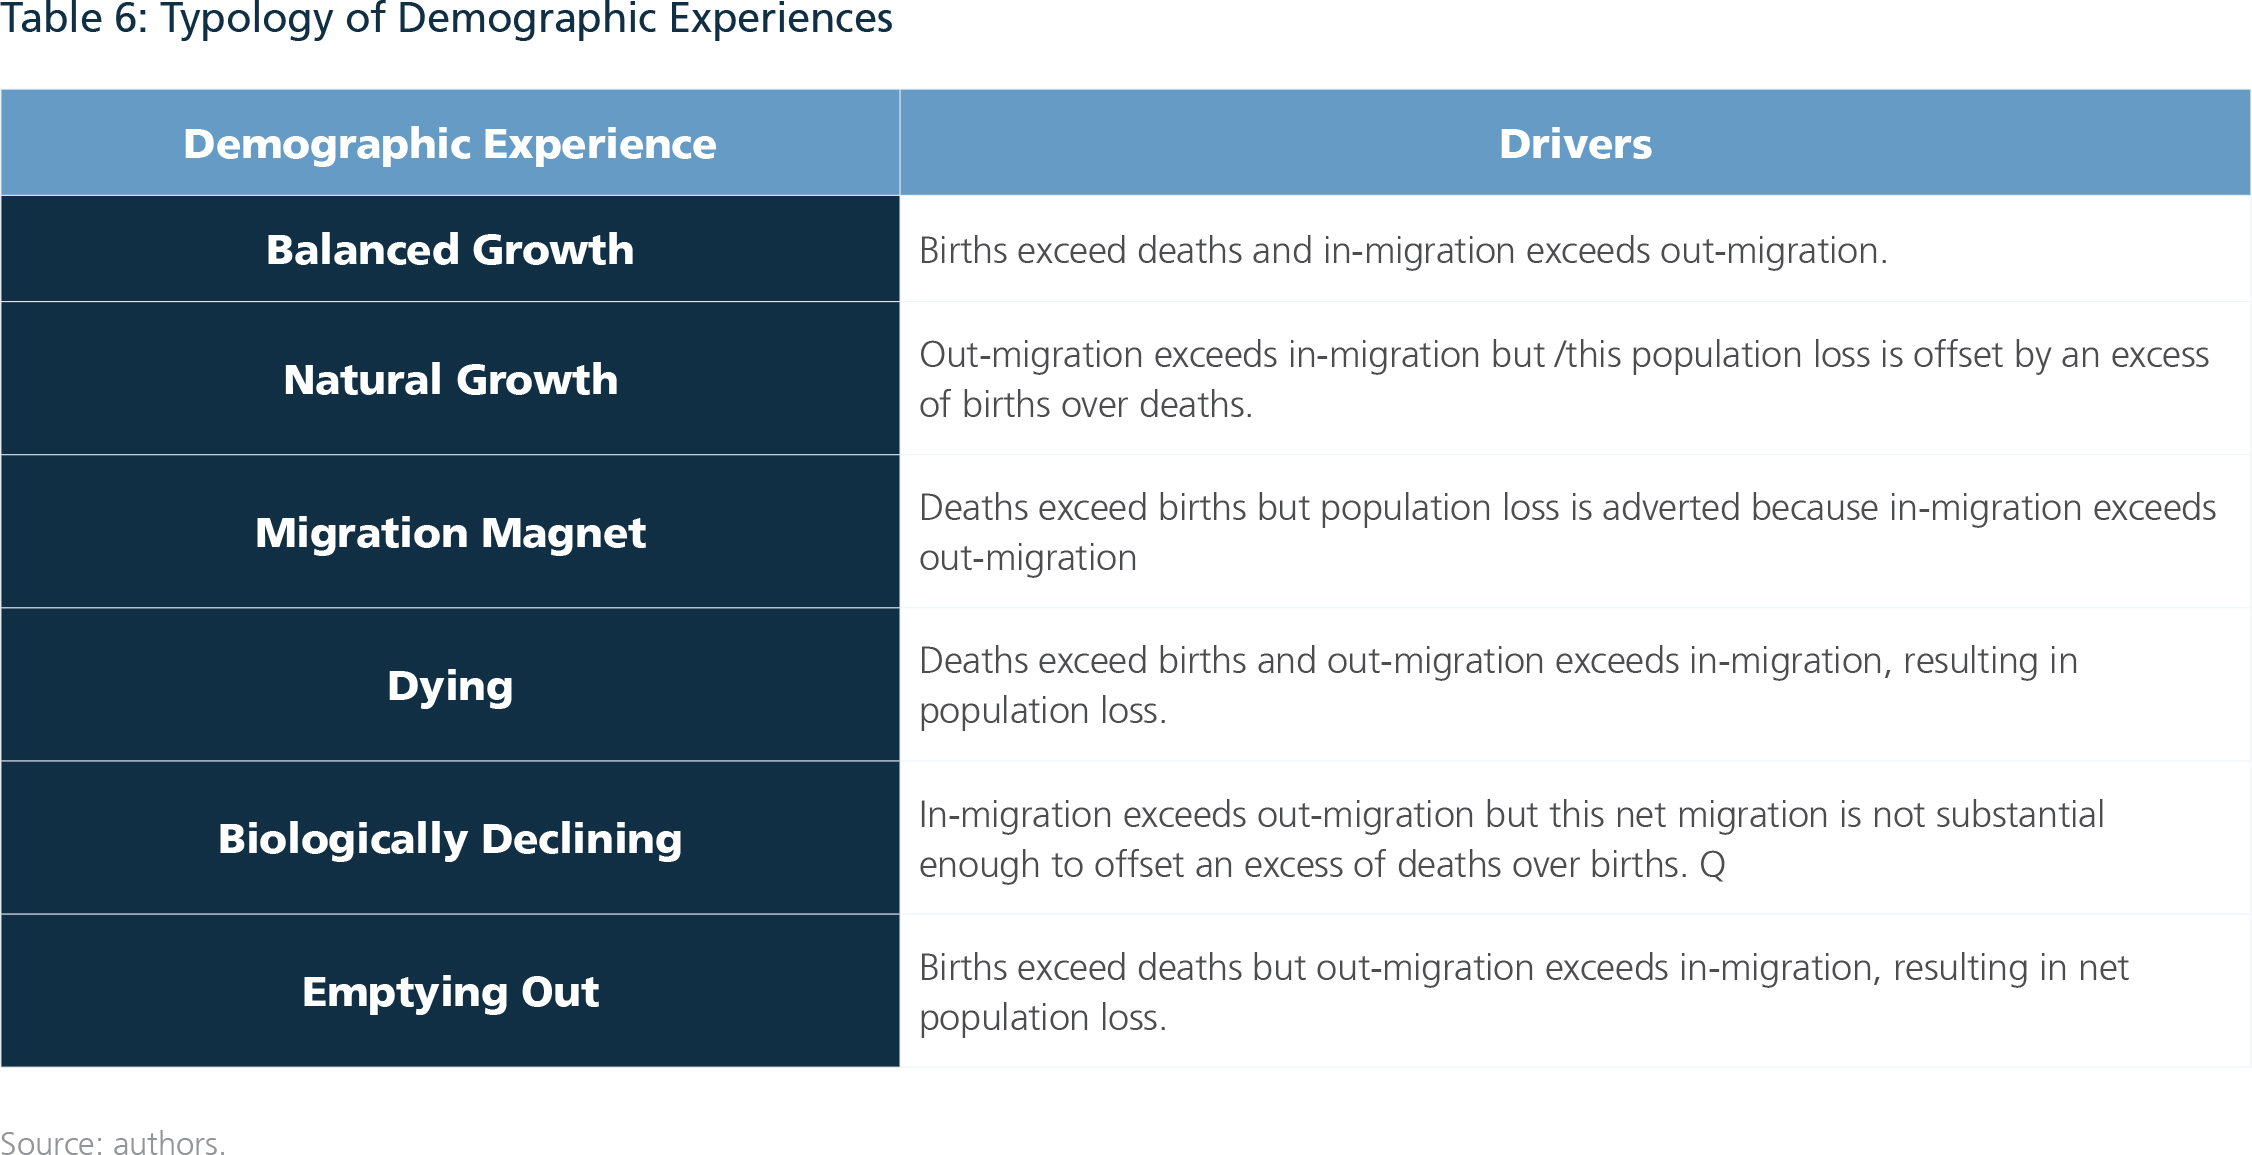
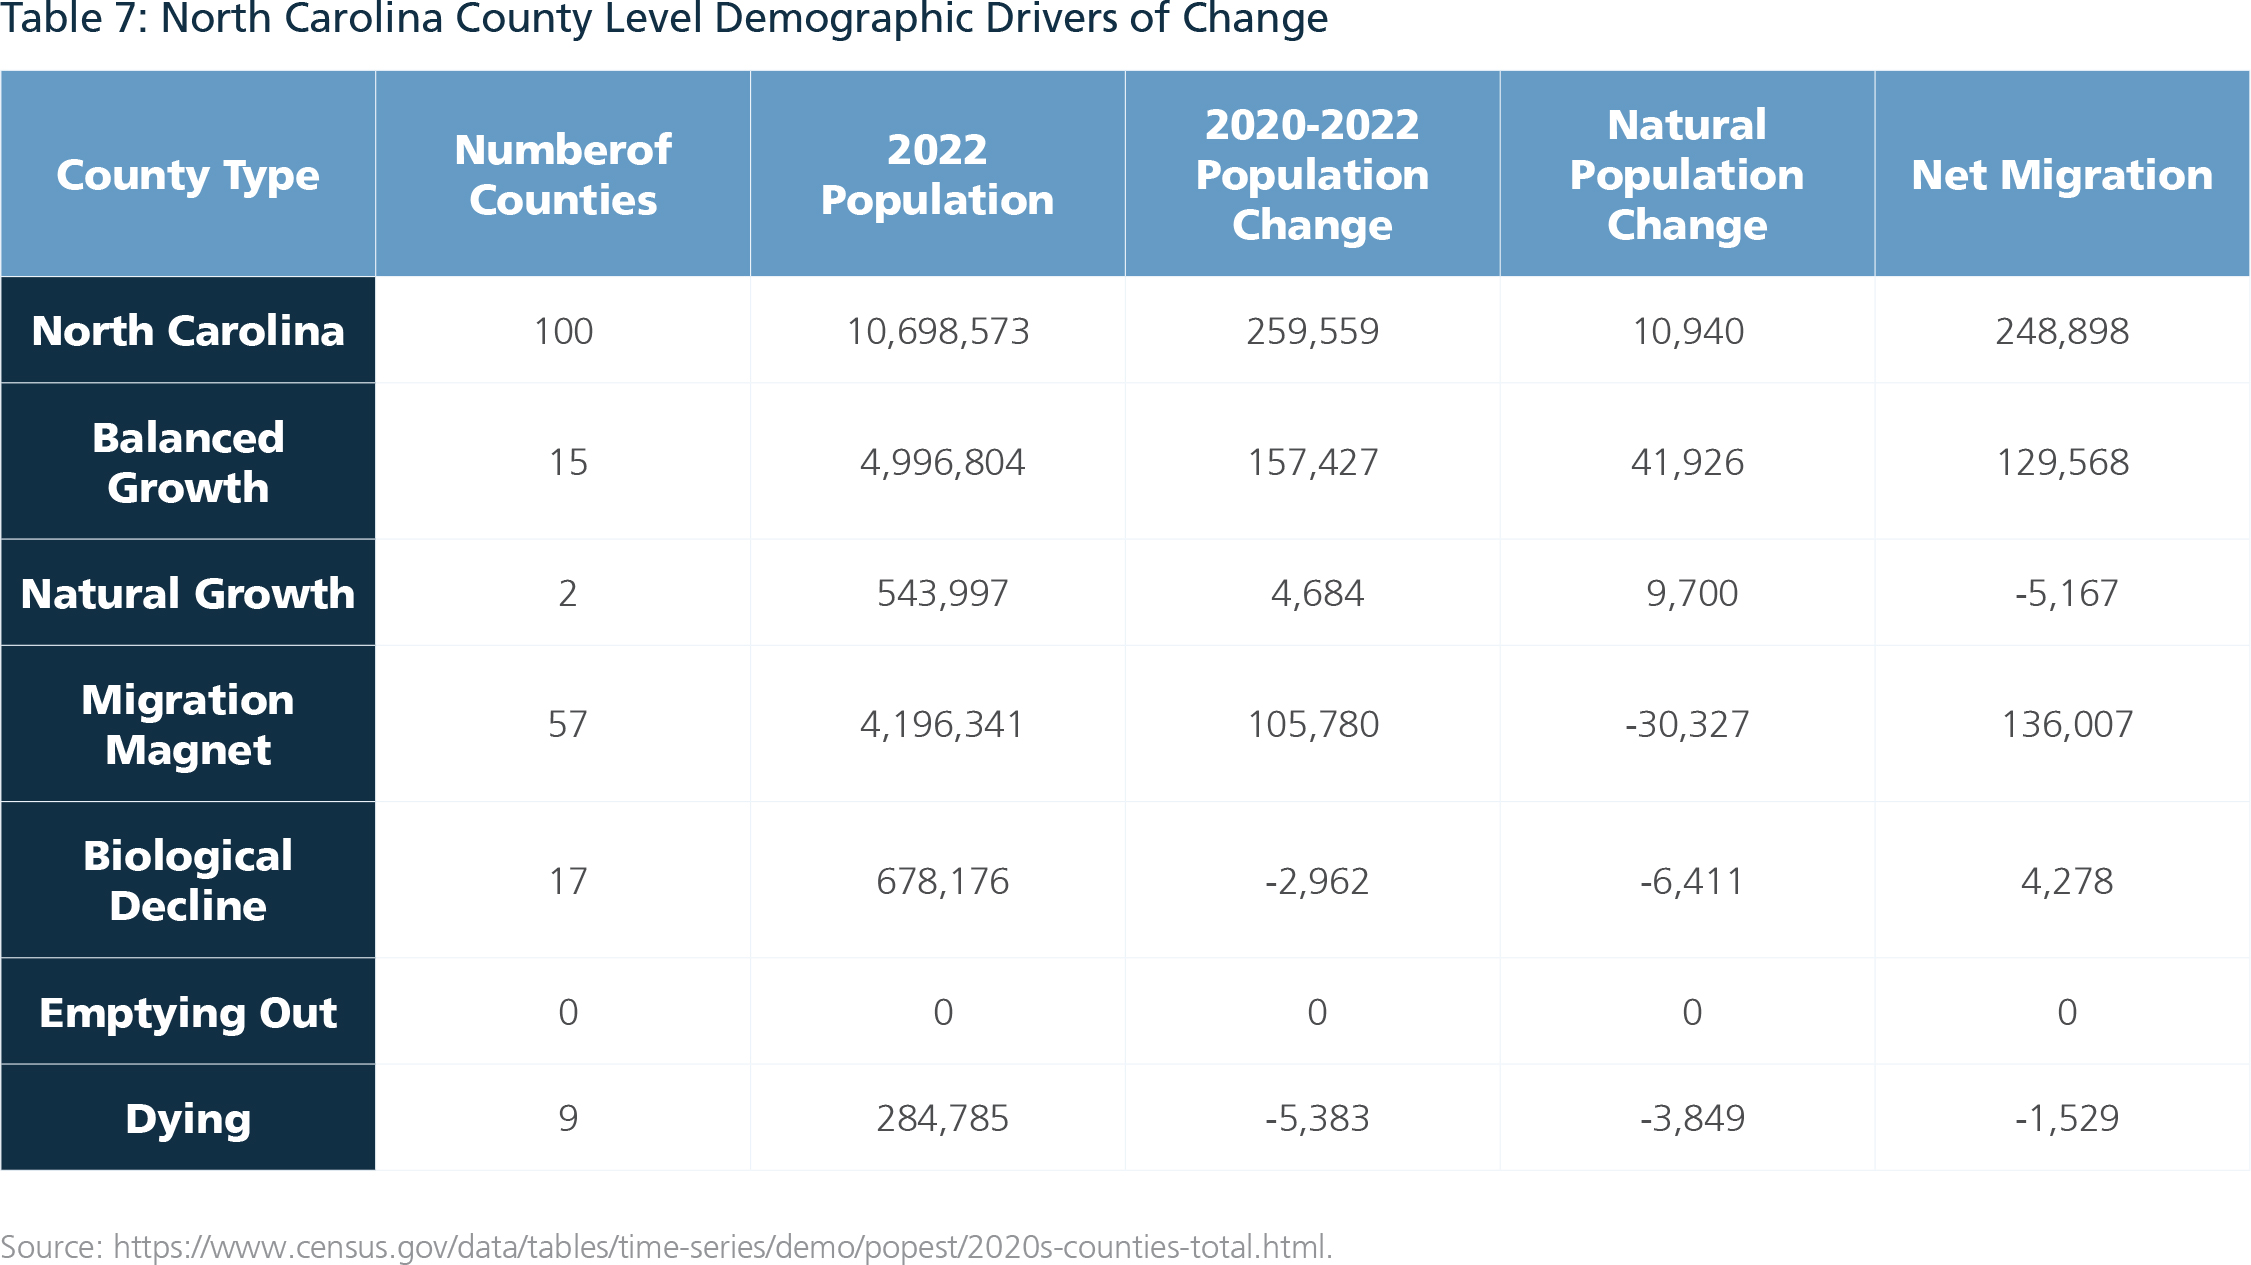
Using this equation, we classified the demographic experiences of North Carolina’s 100 counties into a six- fold typology based on the dynamic interactions among these measures of natural population change (births and deaths) and net migration (in- and out-migration). The typology along with definitions of each of the six types of demographic experiences appear in Table 6 and the corresponding demographic data for North Carolina counties appear in Table 7. Suffice it to state here that three of the entries reflect sources of population growth experiences—balanced growth, natural growth, and migration magnet–and the other three reflect sources of population decline experiences—biologically declining, emptying out, and dying.


Figure 8 shows the demographic experiences of North Carolina counties according to the balance of population change typology. Total, COVID-19, and drug overdose death rates as well as birth rates across the county-level demographic experiences typology appear in the table below the map.

North Carolina counties fall into five of the six categories in the typology: balanced growth, natural growth, migration magnet, biological decline, and dying. No county was “emptying out” between April 2020 and July 2022. Fifteen counties experienced balanced growth, that is, both net migration (129,568) and more births than deaths (natural population increase of 41,925) were sources of growth (157,427). These fifteen counties are the state’s major growth poles, hubs of creativity, innovation, and entertainment which accounted for 61 percent of net growth between 2020 and 2022 and 46 percent of the state’s total population in July 2022. Total, COVID-19, and drug overdose death rates were well below the statewide averages in these 15 counties in 2022.
Two counties—Onslow and Cumberland—experienced natural population growth between 2020 and 2022. In these two counties excess births over deaths (9,700) offset net out-migration (-5,167), resulting in modest growth (4,684). These are both military communities, so this specific demographic pattern is not surprising, especially given the high concentration of young military families, which largely accounts for the well-above average birth rate (37/1000 versus 25/1000 statewide), and high rates of military personnel deployments. What is particularly noteworthy, however, is the exceptionally high drug overdose death rate in these two communities (42.8 vs 35.6 statewide). Research confirms that “U.S. military veterans have been heavily impacted by the opioid overdose crisis” (Bennett, et al., 2022).
Over half of North Carolina counties were migration magnets—major beneficiaries of the state’s post 2020 pandemic induced population boom (136,007), which offset the longstanding trend of net-outmigration from most of these counties (-30,427) and contributed to significant net population growth (105,780). However, deaths rates remained stubbornly high in these counties, especially deaths caused by COVID (45.3) and drug overdoses (42.3), despite capturing 41 percent of the state’s total net growth (259,559) between 2020 and 2022.
Seventeen counties experienced biological decline between 2020 and 2022. Modest net in-migration (4,278) from the pandemic boom was offset by natural population loss, that is, an excess of deaths over births (-6,411), resulting in overall population loss (-2,962). Reflecting aging populations, total (38) and COVID (46) death rates were significantly higher than the respective statewide death rates on these indicators (24 and 36, respectively). Notably, drug overdose death rates in these seventeen counties (37.3) were slightly above the statewide death rate (35.9), but significantly lower than the death rate in natural growth (42.8) and migration magnet (42.3) counties with younger populations.
Nine counties did not benefit in any way from the pandemic population boom. According to our demographic change typology, these counties were literally dying between 2020 and 2022. That is, they experienced population loss due to both net outmigration—more people leaving than entering (-1,529) and natural change—more deaths than births (-3,849). COVID-19, as the table shows in Figure 8 shows, exacted a particularly heavy toll in these counties (53 deaths/100,000).
Concluding Thoughts and Recommendations
Mortality is central to understanding the aging process, and North Carolina is an aging state. But the dynamics of death in the state extend beyond normal aging and are rooted in, among other causes, the COVID pandemic and the drug overdose crisis which is leading to the premature loss of far too many lives. During the 2010s, an average of 246 North Carolinians died each day. That average number increased to 317 per day between April 1, 2020 and July 1, 2022.
The demographic impact of this natural population loss is obscured by the state’s migration-driven absolute population change. However, a cursory look at North Carolina’s aggregate population growth trend over the past three decades highlights the magnitude of the problem and foreshadows a potential worsening of the current worker shortage in the years ahead—if the current death spiral is not properly addressed.
North Carolina’s net absolute population growth in the 2010s (903,000) paled by a substantial margin the absolute growth the state experienced in the 1990s (1.49 million) and the 2000s (1.42 million). Compared to the previous two decades, North Carolina grew by 500,000 fewer people between 2010 and 2020. In relative terms, after growing by 21.4 percent in the 1990s and 18.5 percent in the 2000s, the state experienced a 9.5 percent rate of growth in the 2010s (Johnson, Bonds, & Parnell, 2021a; Johnson, Parnell, and Bonds, 2024).
This slowing growth trend in North Carolina is rooted in a set of disruptive demographic shifts nationally, including slowing total and foreign-born population growth, declining fertility, and white population decline5 —forces that are and will continue to profoundly reshape both the size and composition of population of the U.S. and North Carolina well into the future (Haroun & Hoff, 2021; Bahrampour, et al, 2021; Tavernise & Gebeloff, 2021; Johnson, Parnell, & Bonds, 2024). Due to declining fertility nationally and within the state, for example, we are on the cusp of a major enrollment cliff in both K-12 and higher education (Drozdowski, 2023), which holds enormous implications for the pipeline of talent required to maintain a viable economy, not to mention the threats to education institutions in particular as hubs of innovation.
Against the backdrop of these national demographic trends, North Carolina leaders must leverage the lessons learned from the COVID crisis to develop sound policies, practices, and procedures to minimize population exposure risks and mitigate loss of life in future public health crises, including adverse weather events caused by climate change. In addition, in this research, we have identified both groups of North Carolina citizens and places within the state that not only are highly vulnerable to future public health and climate risks but also the vagaries of the aging process and the drug scourge. Consequently, both people-based and place-based strategies are necessary to successfully intervene in North Carolina’s death crisis.
Two demographic groups are clearly at risk of premature deaths due to substance abuse: prime working age white males with less than a college education and Native Americans. While the state has a drug abuse intervention action plan, targeted efforts to stem the tide of premature deaths among these two demographic groups are urgently needed—not solely as a public health intervention but also as a strategic workforce and business imperative. And, building on the lessons learned from the COVID-19 pandemic, we must target these two groups with trusted messages from trusted messengers that are rooted in the best available scientific evidence about culturally appropriate interventions and treatment modalities (Johnson, Bonds, and Parnell, 2021b,c).
Among the five community types identified in North Carolina, death rates are high in three: dying, natural growth (military communities), and migration magnets where growth is limited to isolated pockets or specific areas within constituent counties. Across and within these three county types are communities and neighborhoods with aging and vulnerable populations, a dearth of employment opportunities, deteriorating infrastructure, a host of life threatening locally unwanted land uses, and limited access to high quality health care. And many of the vulnerable households in these communities live in houses that are “unaffordable,” meaning housing costs exceed 30% of their income (Rosenfeld, 2023).
Geographic Information Systems (GIS) should be used to identify these “communities of despair” and a whole community health approach aligned with the social determinants of health must be implemented, leveraging available state dollars from the opioid settlement (Johnson, Bonds, & Parnell, 2022). In addition, especially in dying counties, expanding Medicaid and leveraging AARP’s age- friendly infrastructure interventions will contribute to greater longevity and reduce the debilitating health effects of caregiving, which is a major workforce issue (Henderson and Johal, 2022; Kalita, 2022; AARP Livable Communities, 2014)
Finally, incentive programs to encourage people, including both return and international migrants, to relocate to dying counties also should be developed—as an enlightened workforce development strategy to attract industry and commerce as well as mission driven entrepreneurial ventures that improve community health and wellbeing (Johnson, Bonds, & Davis, 2023). Communities with declining and slow growing populations in other states and regions of the country have reported successes with such people-based incentive programs which are pursued along with business recruitment initiatives (Berger, 2022; Bloom, 2021; Kelly, 2021). The migration incentives include, as we have shown elsewhere (see Table 6 in Johnson, 2021a), relocation expenses, tax credits, forgivable mortgages, student loan repayment, cash, and land. Such incentives, properly marketed in the current remote work environment, can potentially breathe new life in North Carolina communities caught in a downward spiral of deaths of despair.
About the Authors
James H. Johnson, Jr. is the William Rand Kenan, Jr. Distinguished Professor of Strategy and Entrepreneurship in the Kenan-Flagler Business School and Director of the Urban Investment Strategies Center in the Frank Hawkins Kenan Institute of Private Enterprise at UNC-Chapel Hill.
Jeanne Milliken Bonds is a Professor of the Practice, Impact Investment and Sustainable Finance in the Kenan-Flagler Business School and the Department of Public Policy at UNC-Chapel Hill.
Allan M. Parnell is a Senior Research in the Kenan Institute’s Urban Investment Strategies Center and Vice President of the Mebane, NC-based Cedar Grove Institute for Sustainable Communities.
The Kenan Institute serves as a national center for scholarly research, joint exploration of issues, and course development with the principal theme of preservation, encouragement, and understanding of private enterprise.
Related Articles
Virginia’s Shifting Demographics and the Future Competitiveness of the Commonwealth
Virginia's Shifting Demographics and the Future Competitiveness of the CommonwealthA Whole Community Health approach to Virginia’s rapid population growth over the past three decades.White Paper written by James H. Johnson Jr., Allan M. Parnel, Jeanne Milliken Bonds,...
Real Estate Alert! Gale Force Demographic Wind Gusts Ahead
Real Estate Alert! Gale Force Demographic Wind Gusts AheadNewcomers from other states and abroad are principally responsible for North Carolina’s population boom–growth by 3.9 million– since 1990. However, seven powerful demographic disruptors—analogous to gale force...
Business Alert! Gale Force Demographic Wind Gusts Ahead
Business Alert! Gale Force Demographic Wind Gusts AheadSeven powerful demographic trends—analogous to gale force wind gusts in an adverse weather event—constitute potentially powerful disruptors of business and commerce in the years ahead. White Paper by James H....


