Warning: Demographic Headwinds Ahead
William Rand Kenan, Jr. Distinguished Professor
Kenan-Flagler Business School UNC-Chapel Hill
September, 2020
ABSTRACT
Knowledge of our changing demography can serve as both foundation and frame for how to achieve greater social, economic, environmental, and health equity in North Carolina. After describing how disruptive demographics are transforming the our state, this essay highlights a set of equity issues undergirding our shifting demography and concludes with a set of tools and strategies to make North Carolina a place where equity, inclusion, and belonging is the new normal.
INTRODUCTION
Shifts in our demography are dramatically transforming the social, economic, and political fabric of our nation, our state, and all of our local communities (Johnson and Parnell, 2019). Knowledge of our changing demography, I believe, can serve as both foundation and frame for our continued deliberations regarding how to achieve greater social, economic, environmental, ad health equity in the state of North Carolina.
My aspirational goal, in making this presentation, is to contribute to the shaping of the recommendations ultimately forwarded to Governor Cooper in early December. I therefore shall first, briefly describe how disruptive demographics are transforming our great state; then highlight a set of equity issues undergirding our shifting demography; and conclude with a set of proposed equity tools I believe are worthy of consideration in our deliberations moving forward.
THE STATE AS A MIGRATION MAGNET
North Carolina is one of the nation’s most attractive migration destinations. In 2017, an average of 194 newcomers arrived in the state each day. As a popular migration destination, the state’s population grew more rapidly than the nation’s and the South’s population between 2010 and 2019, increasing by 932,000 in absolute numbers (Table 1). Combined with a net population increase of 2.1 million during the preceding decade, North Carolina’s population has grown by almost 3 million since 2000. The state also has become more diverse with immigrants and people of color driving much of the growth dating back to the 1990s (Figures 1).
GEOGRAPHIC EQUITY ISSUES
To fully understand the state’s demographic landscape—and by extension where equity interventions are most needed, it is informative to view the state through the lens of the balance of population change equation (Figure 5). For any community, according to this demographic accounting model, population change is a function of in-flows and out-flows.
Applying this model at the county level reveals that 57 of North Carolina’s 100 counties experienced population growth between 2010 and 2019. The remaining 43 counties experienced population decline (Figure 6).
Thirty counties experienced balanced growth. In these counties, which are the major beneficiaries of the state’s migration dividend, in-migration exceeded out migration and births exceeded deaths. These are mainly metropolitan counties in the state’s urban crescent, extending from Johnston County in the east along the I-40/I-85 corridor to Mecklenburg County in the southwest.
Six counties—mainly with military installations (Cumberland, Onslow, and Wayne) and/or an influx of Hispanics with above replacement level fertility (Duplin, Sampson and Wilson)– grew solely as function of natural population increase. In these natural growth counties, out-migration exceeded in-migration but an excess of births over deaths was sufficient to offset population loss through migration due to military deployments in all likelihood.
Twenty–one counties were migration magnets. In these counties deaths exceeded births, but net migration of mainly retirees offset the natural population loss through excess deaths. Brunswick, Henderson, Moore, and Chatham counties are the most notable migration magnets in this group.
Most troubling are the 22 counties that are literally dying demographically. These counties are located throughout the state with notable concentrations in the northeast, southeast, and the mountains. In these counties, deaths exceeded births and out-migration exceeded in-migration. There are too few working age, taxpaying adults to support the elderly population in these communities, which is disproportionately female because men die younger (Johnson and Lian, 2018; Johnson and Parnell, 2016).
Hospitals have closed or risk closing. There are not enough senior care facilities to accommodate demand, and patients with serious ailments must travel long distances for health care (Gujral and Basu, 2019; Ellison, 2018; Radcliffe, 2017; Miller, et. al., 2020)). Moreover, it is a major challenge for health care facilities in these communities to recruit and retain health professionals. Moreover, leveraging tele-health services is difficult, if not impossible, due to the lack of access to broadband bandwidth sufficient to support the service.
Only slightly less concerning are the 11 counties that are experiencing biological decline. In these counties, in-migration exceeds out-migration, but the influx of newcomers is not sufficient to offset population loss due to natural causes, that is, more deaths than births. The counties are dispersed in both the east (Pamlico and Beaufort) and especially the west (Mitchell, Wilkes, Avery, Alleghany, Caldwell, Rutherford, Cleveland, Ashe and Burke). Although relatively small, these counties also are attracting retirees.
The final group of declining counties are emptying out demographically. In these 10 counties, births exceed deaths, but out-migration is much greater than in-migration and natural growth combined, resulting in population loss. Most of these counties are located in eastern North Carolina (Edgecombe, Greene, Nash Pasquotank, Craven and Robeson).
We urgently need strategies to reduce the outflow of existing residents, to attract new talent, and to ensure adequate access to essential services like health care for the existing residents of these declining counties, especially those that are dying. In addition to one or more physical ailments, many older adults in these counties suffer from loneliness and isolation, conditions that are health wise the equivalent of smoking fifteen cigarettes a day (Morin, 2018).
DEMOGRAPHIC EQUITY CONCERNS
In addition to the geographic inequities that undergird demographic patterns in our state, at least five noteworthy demographic subgroups require urgent attention if we are serious about making North Carolina a more inclusive and equitable place to live, work, play, and start and maintain sustainable businesses. Table 3 identifies these subgroups.
VULNERABLE AFRICAN AMERICAN OLDER ADULTS
African American older adults who face major aging-in-place challenges are the first group. Due to a historical legacy of discrimination in education, housing, and employment, the poverty rate for African American older adults is more than twice as high as the poverty rate for all older adults and three times as high as the poverty rate for non-Hispanic white older adults (Johnson and Lian, 2018). Moreover, reflective of disparate treatment they have endured, African Americans are more likely to experience disability earlier and, therefore, have shorter years of active life expectancy than whites (Friedman and Spillman, 2016).
Research defines the most vulnerable as households in which there is at least one African American 65 or older and where the head of household is either a renter or a person financially burdened by excessive monthly housing cost, irrespective of whether they own or rent their dwelling unit (Johnson and Lian, 2018). In North Carolina, as Figure 7 shows, there are 89,569 such households with 175,741 inhabitants.
Because people of color are more likely to occupy multigenerational households than Whites, the living arrangements of African American older adults are diverse. In North Carolina, three distinct living arrangements are commonplace.
The majority of the state’s vulnerable African American older adults live independently in one generation, single person or married-couple households (74 percent) (Figure 7). That their median household income is $15,000 is more than ample evidence of their plight (see Johnson and Lian, 2018).
The second largest group are elderly African American single parents or married couples who are supporting their own adult child (two-generation households); their own adult child and a grandchild or some other relative (three-generation households); or a grandchild where neither biological parent of the grandchild is present (missing generation households). These are caretaker households (Figure 7). The elderly African American household heads are assuming caretaking responsibilities on a median household income of $25,000 (Johnson and Lian, 2018).
Non-elderly caregivers head the third group of North Carolina households where a vulnerable African American older adult is present (Figure 7). The household heads are mostly married couples in their late forties or early fifties with modest household incomes (median $39,000) who are taking care of an older adult parent or parent-in law (two-generation households); or supporting their own biological child and an older adult parent or parent-in-law (three-generation household) (Johnson and Lian, 2018).
Across these living arrangements, most of the African American older adults have at least one age-related disability and may very well be responsible, in some instances, for the care of a disabled adult biological child or grandchild. The majority live in renter-occupied housing, and among those who live in owner-occupied housing, only a small percentage own their homes outright. The typical dwelling unit is 40 years old and a substantial share of the African American older adults have lived in the current dwelling unit for twenty years or longer (Johnson and Lian, 2018).
THE WORKING POOR
The second group in North Carolina that raises equity concerns is the state’s working poor— people who work every day but do not earn enough to cover basic necessities. A profile of the working poor in two counties—one rural and the other urban—illustrates the equity issue.
In rural Edgecombe County, people of color (Blacks, Hispanics, Asians, etc.), women, and those 19-34 years of age, with a high school degree or less, never married or divorced, and working in personal care and service occupations, sales, and farming are over- represented among the working poor population (Figure 8). Durham County — an urban community — has a similar working poor profile (see Johnson, McDaniel, and Parnell, 2019). However, as Figure 9 reveals, there also are some civil servants in Durham County — police, firefighters, and emergency personnel, as well as public school teachers — who are employed full-time in jobs that do not pay them enough to cover basic necessities. These individuals cannot afford to live in the community that they have been hired to protect and serve.
In both counties, stressful personal and family life circumstances, including in some instances structured homelessness (meaning the individuals are couch surfers in the homes of family and friends or they rent hotel rooms on a weekly basis), force the working poor to take moonlighting part-time jobs to make ends meet. Making matters worse, the working poor are often caregivers of young and/or older family members. These stressful life events not only affect their own health and socio-emotional wellbeing; they also put additional pressures on the N.C. healthcare system — especially urgent care units and hospital emergency rooms.
THE LESS THAN COLLEGE EDUCATED
The less than college educated, 25-44 year-old population is a third group that raises equity concerns (Case and Deaton, 2020; MacGillis and Propublica, 2016). Reportedly not benefitting from economic growth, lacking access to health care, and suffering from debilitating pain due to disabilities typically observed later in life among older adults (Chira, 2016a,b; Graham, 2017), research asserts this population nationally is experiencing a demographic depression (Kristof, 2020).
Supporting this assessment, a high rate of “deaths of despair” in this population — suicides and alcohol- and drug-induced deaths — contributed to a decline in U.S. life expectancy in three of the last four years (Koller, 2019; Kristof, 2020; Case and Deaton, 2020). Elaborating on the magnitude of the problem, one-writer notes:
In 2017 alone, there were 158,000 deaths of despair in the U.S., the equivalent of ‘three fully loaded Boeing 737 MAX jets falling out of the sky every day for a year (Karma (2020).
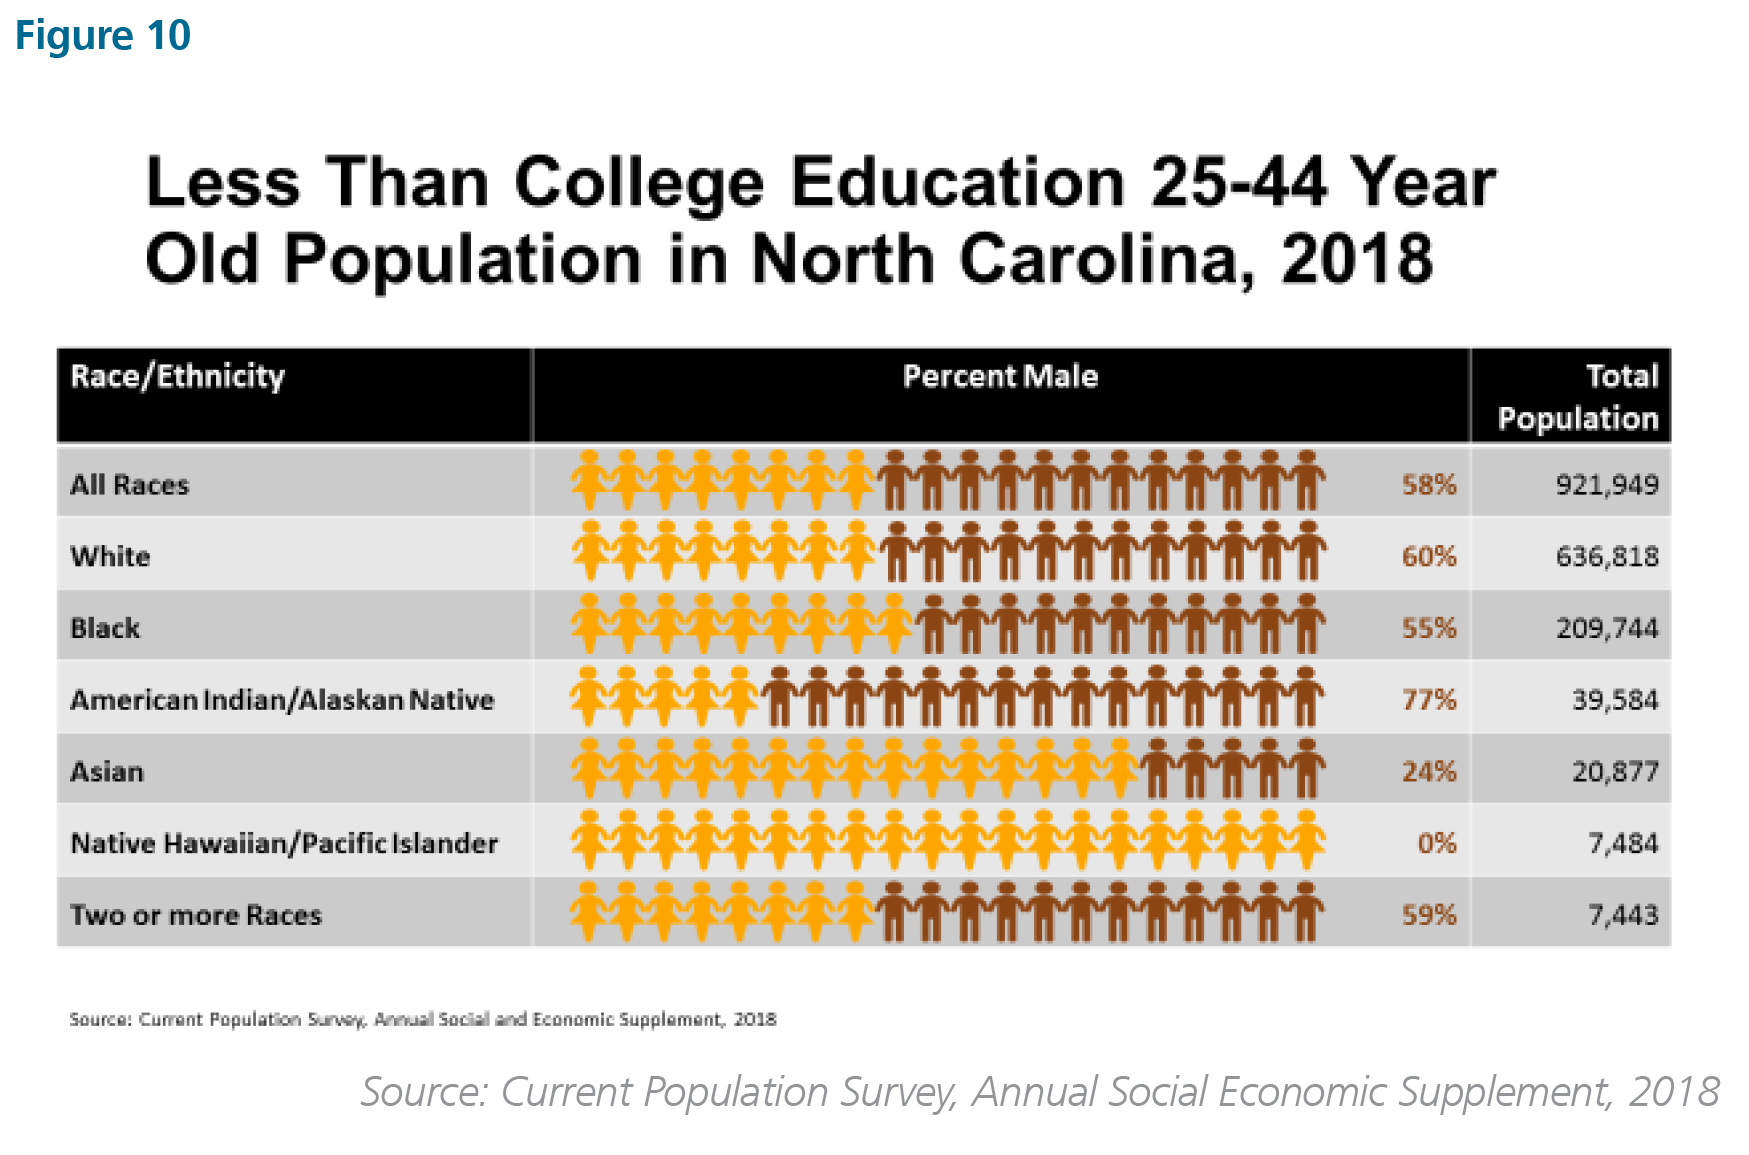
In 2018, roughly one quarter of North Carolina’s total population was 25-44 years old (2,627,416). Slightly over a third of those ages, 25-44 (35% or 921,949) had less than a college education (Figure 10). This population is predominantly White (69%) and disproportionately male (58%). However, compared to their representation in the total 25-44 population, Blacks (males and females) and American Indians (males) are slightly over-represented among those with less than a college education in North Carolina.
Race- and age-specific indicators of demographic depression among this age group in North Carolina are not available. However, data on the geographical distribution of less than college educated 25-44 year olds and the per capita distribution of opioid pills by county — one potential indicator of the magnitude of the problem–are available (Figure 11).
In 2018, 445 million opioid pills were dispensed in North Carolina —an average of 43 pills per person. At the county level, the number of pills dispensed per capita ranged from a low of less than 30 in metropolitan counties such as Durham, Mecklenburg, and Wake to a high of between 70 and 110 pills per capita in some of the state’s rural counties with a high concentration of less-than-college-educated residents (e.g., Rockingham, Gaston, and Roberson). The visual correlations in Figure 11 suggest there is a link between opioids drug use and the less than college educated in North Carolina.
The impact of opioids on individuals, families, and communities in our state has been devastating (FIGURE 12). In 2018, there were 1,718 overdose deaths, an average of five per day. Opioid-related hospital emergency department visits totaled 6,764, roughly 18 per day. In addition, there were 3,723 Naloxone Reversals, roughly ten per day.
Opioid-related causalities and other deaths of despair (suicide and alcohol –related) reduce the pool of potential talent to fill pressing labor needs in our economy moving forward. Moreover, those who die often leave behind orphaned children, which puts enormous pressure on extended families and the state’s child welfare system (Johnson, Parnell, and Lian, 2019).
DISADVANTAGED YOUTH
The fourth group with serious equity concerns is the predominantly minority youth under age 18. They face a triple whammy of geographic disadvantages (Johnson, et. al., 2016). These young people are concentrated in counties and school districts where there is inadequate political (racial generation gap counties)2 and/or financial support (minority-majority counties)3 for their education (whammy #1).4 They also live in hyper-segregated (whammy #2) and concentrated poverty (whammy #3) neighborhoods and communities (Figure 13).
Making matters worse, students in triple whammy communities often attend schools with aging and rapidly deteriorating infrastructure that pose a risk to their health and wellbeing. And more often than not, school-based supports — including access to nursing services — are insufficient to address the students’ physical and socio-emotional development needs, a situation exacerbated in some instances by elected officials’ refusal to expand Medicaid in their states (Kaiser Family Foundation, 2020).
Ensuring access to basic necessities and preventable medical care for these young people and addressing the racially disparate impact of disciplinary sanctions in schools serving these triple whammy communities is a strategic imperative. They are the next generation who will have to propel our state forward in a hyper-competitive and highly volatile global marketplace (Johnson, et.al., 2016).
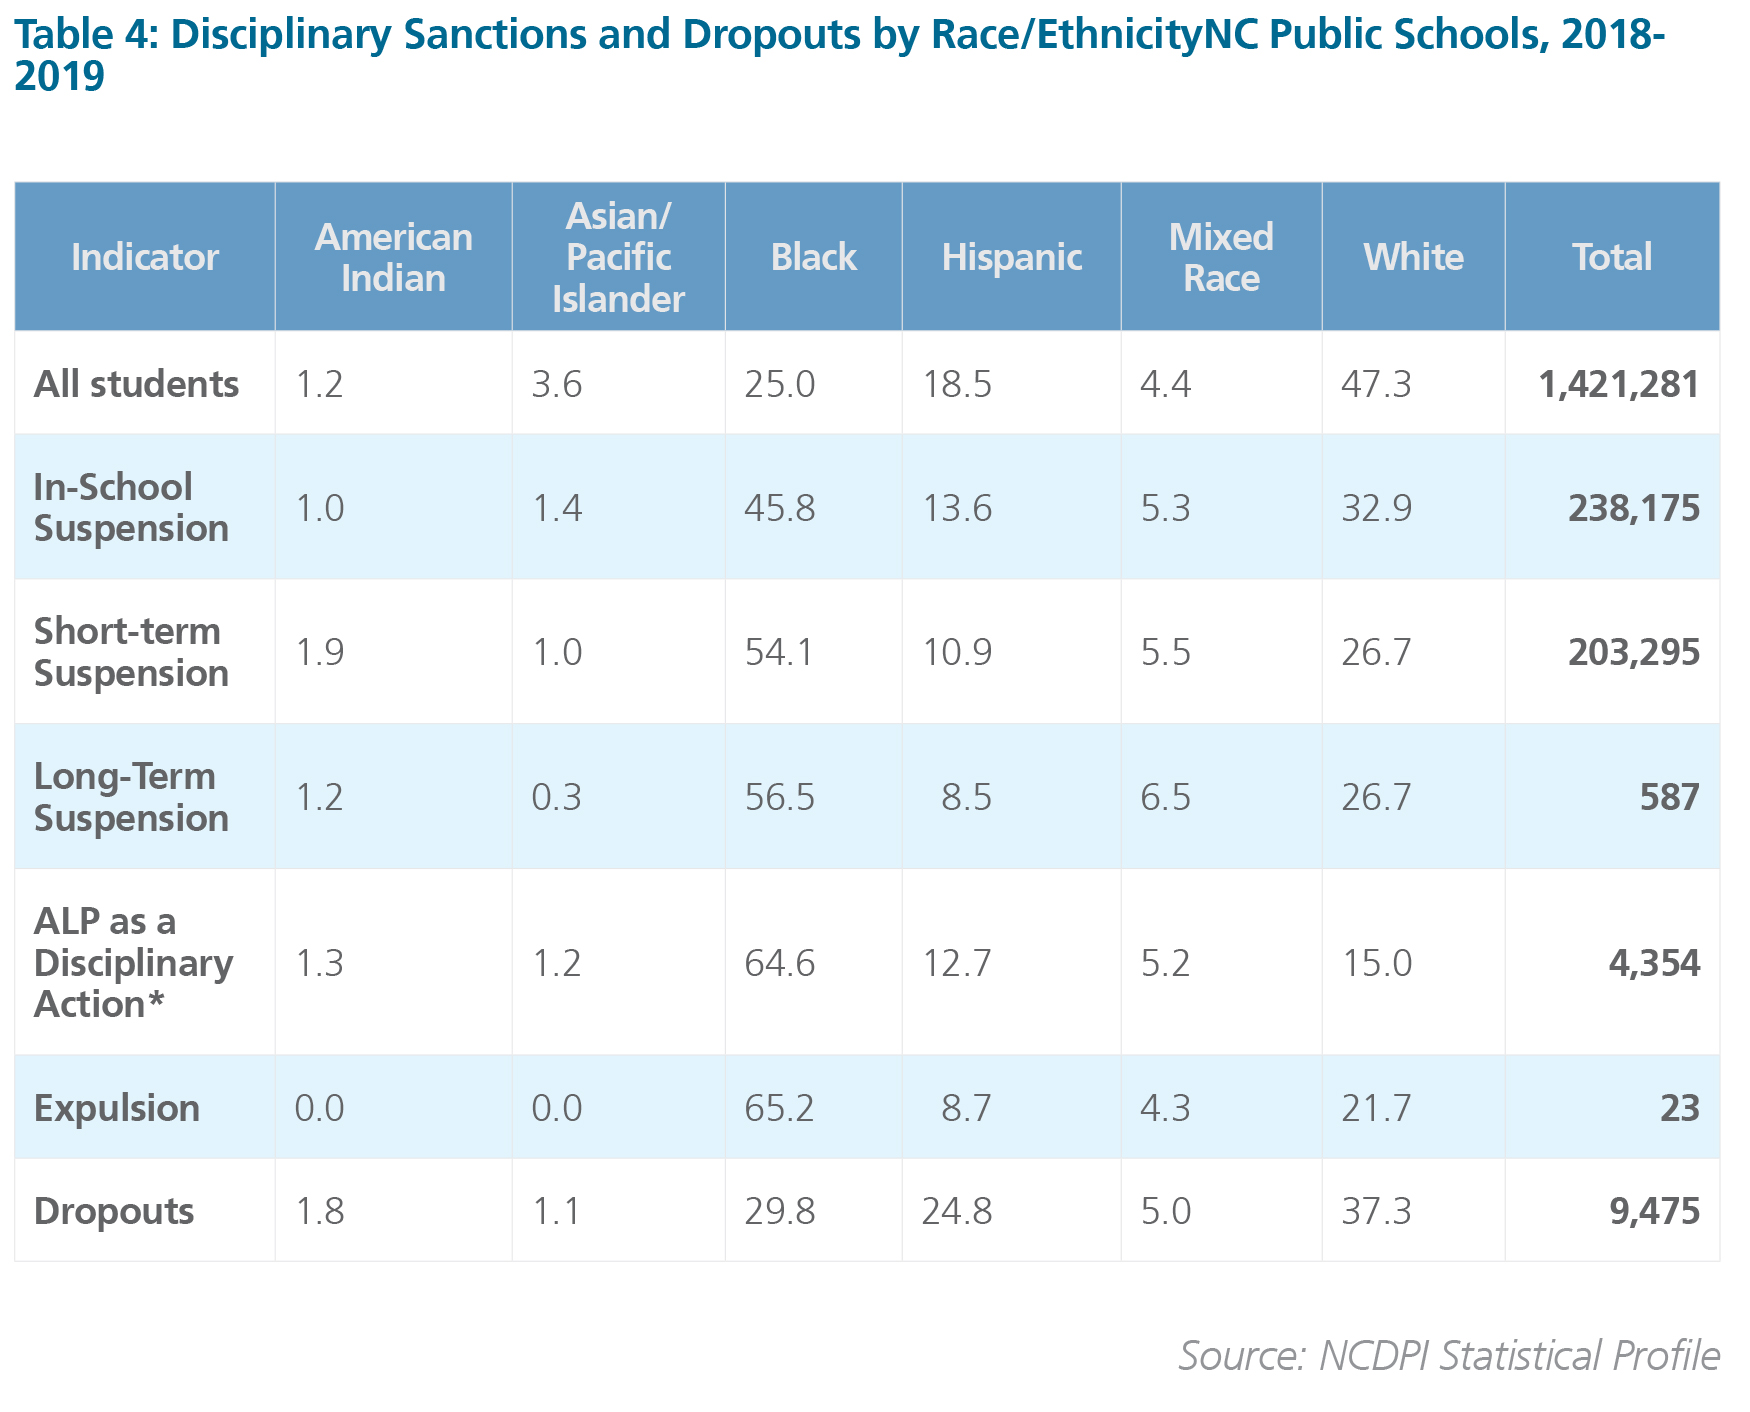
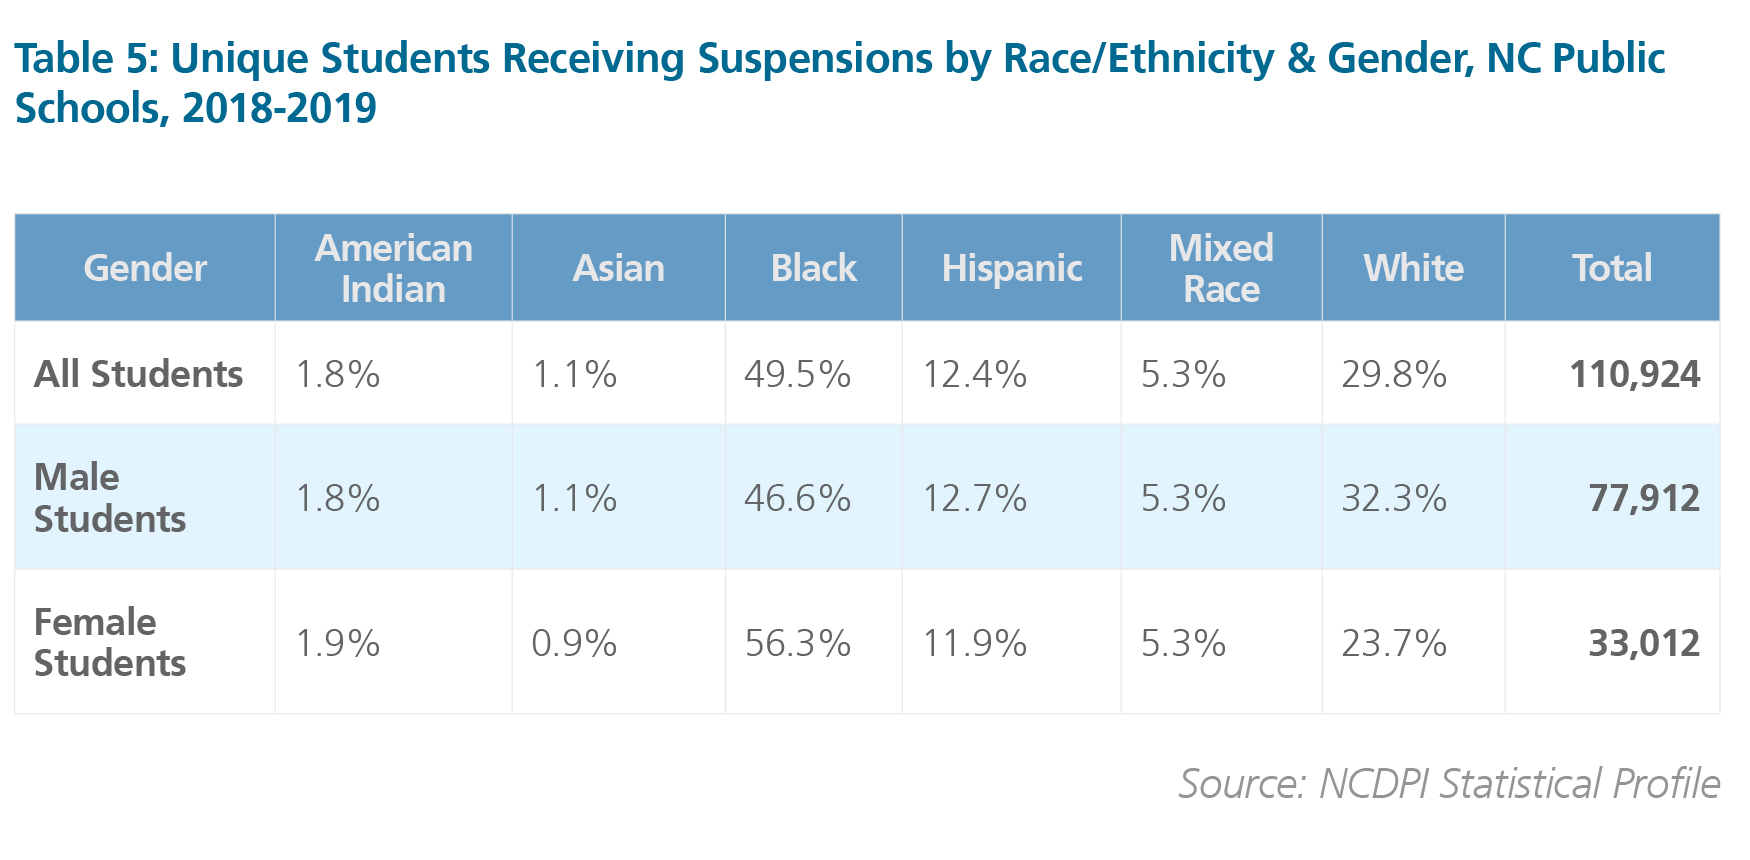
Racially disparate disciplinary sanctions, in particular, contribute to dropping out of school, especially for Black and Latino males (Table 4 and Table 5). Failure to improve education- and life-outcomes for males of color, especially those living in triple whammy communities, has contributed to a major shift in the gender composition of higher education.
MINORITY MALES IN HIGHER EDUCATION
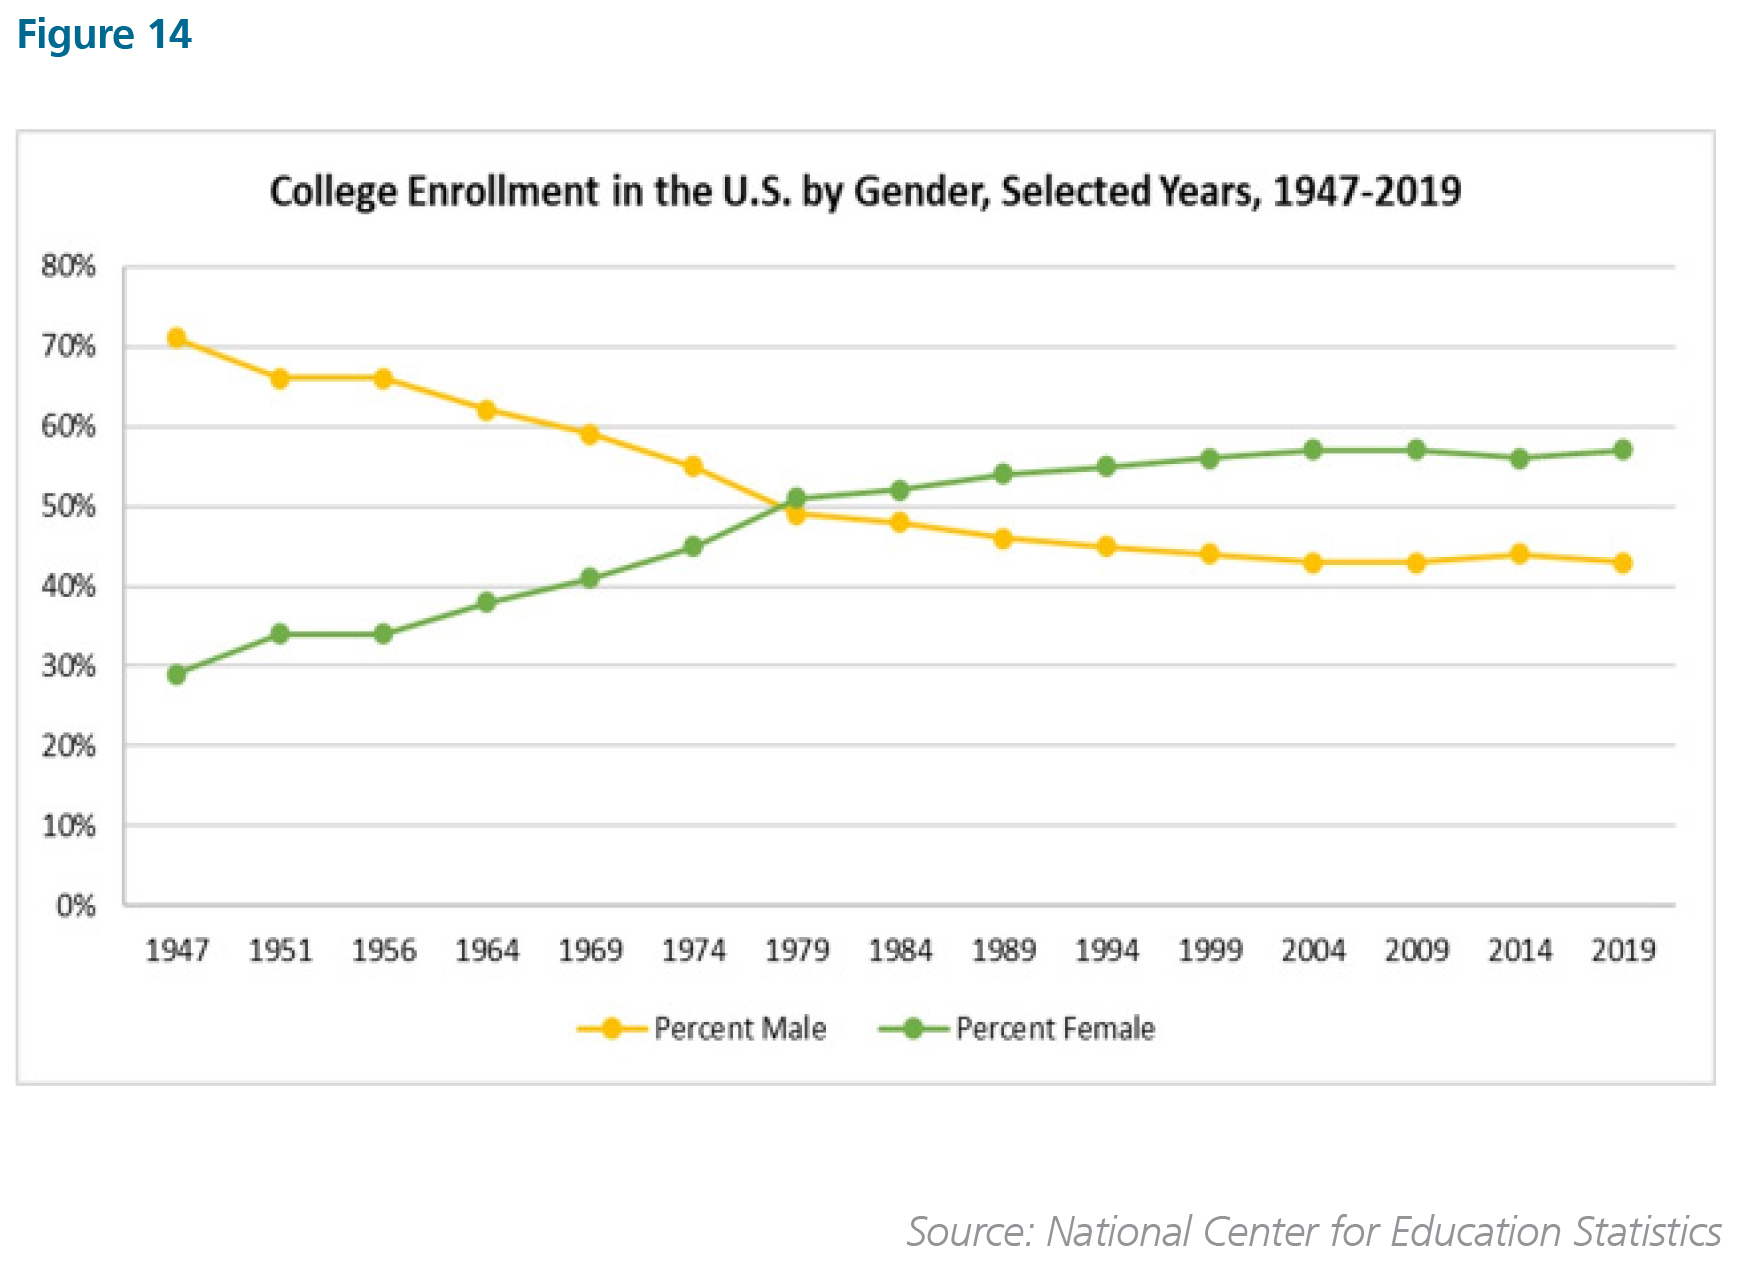
Across the U.S., the gender ratio in higher education has hovered around 60 percent female / 40 percent male since around 1979 (Figure 14). The fact that males in general are doing poorly in America today, plagued by education and skills mismatches, disabilities, and incarceration, is the primary reason for this shift from a historically male-dominated to a female-dominated higher education system (Lukas, 2016; Chira, 2016a,b; Graham, 2017). For students of color, the gender gap is wider than it is for all students (McBride, 2017).
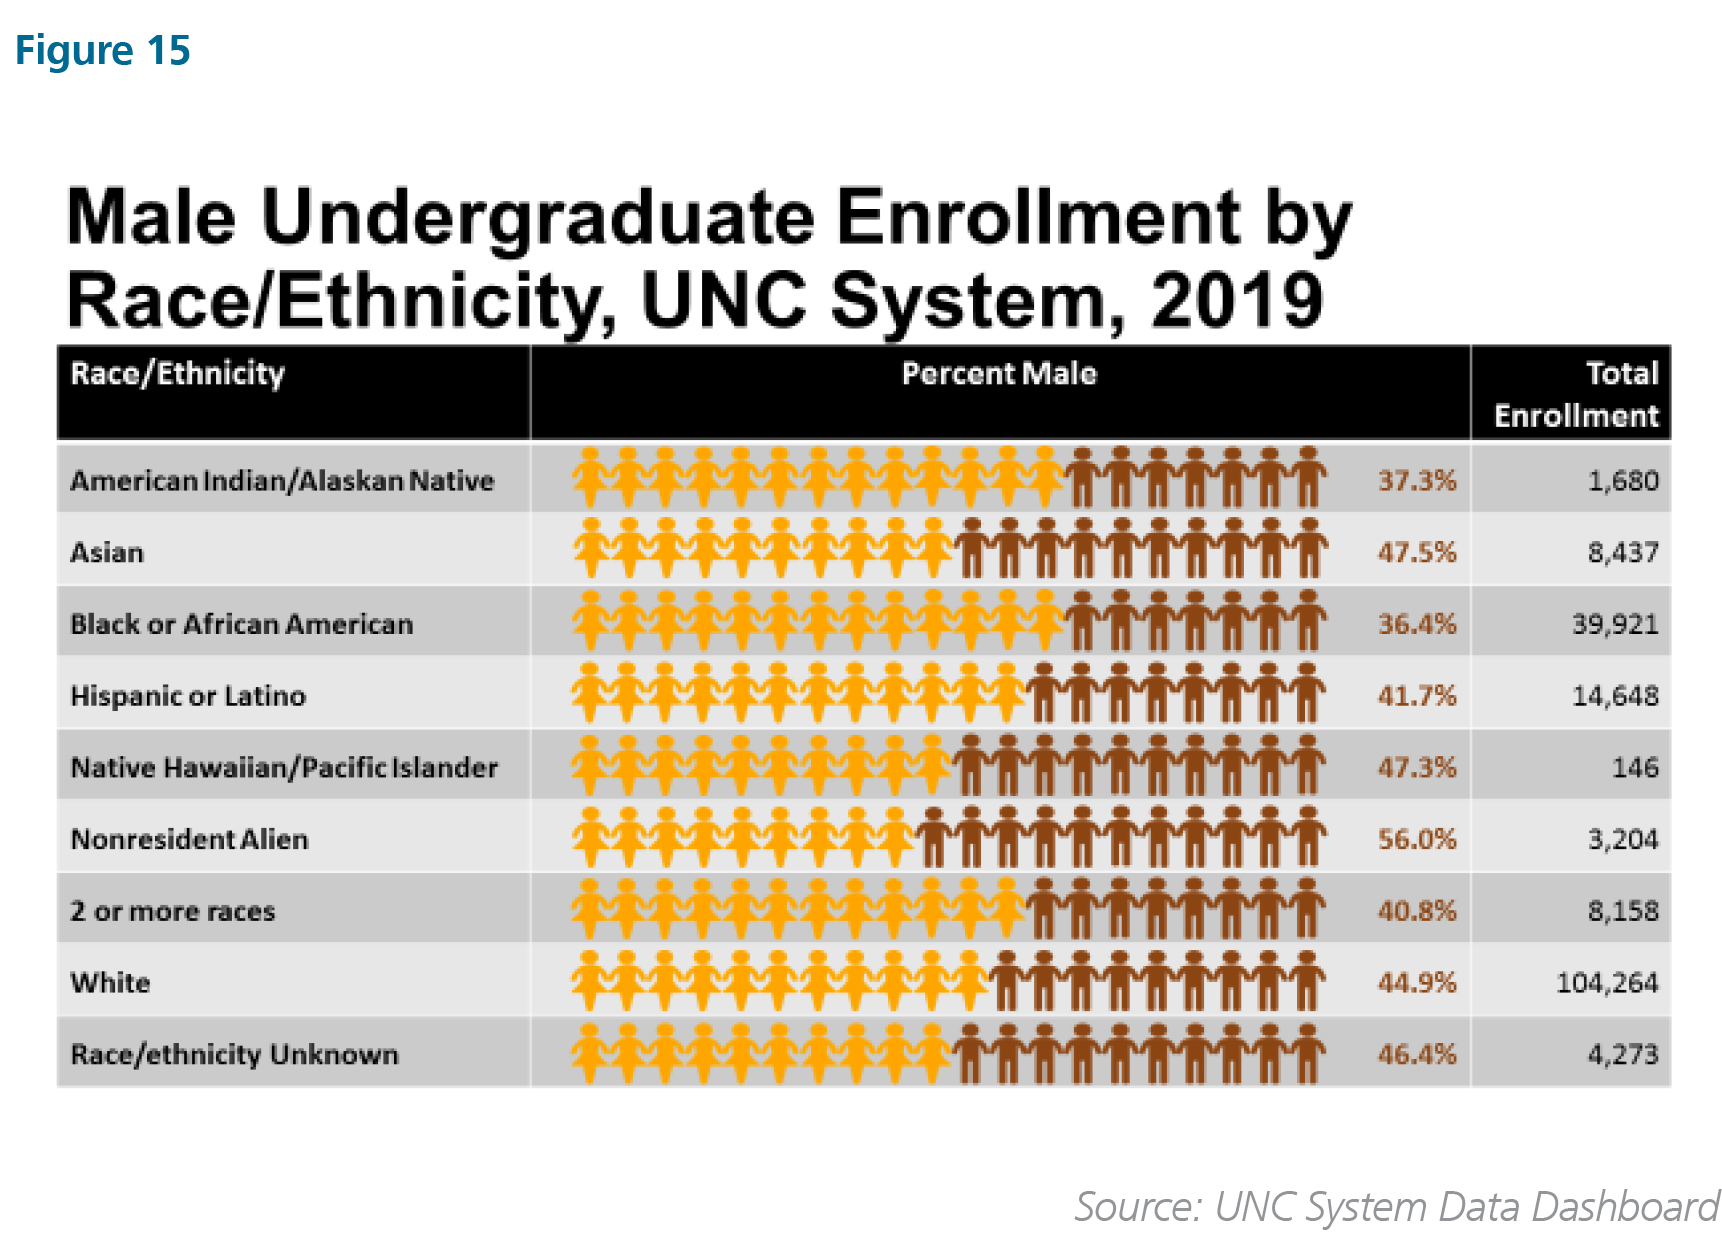
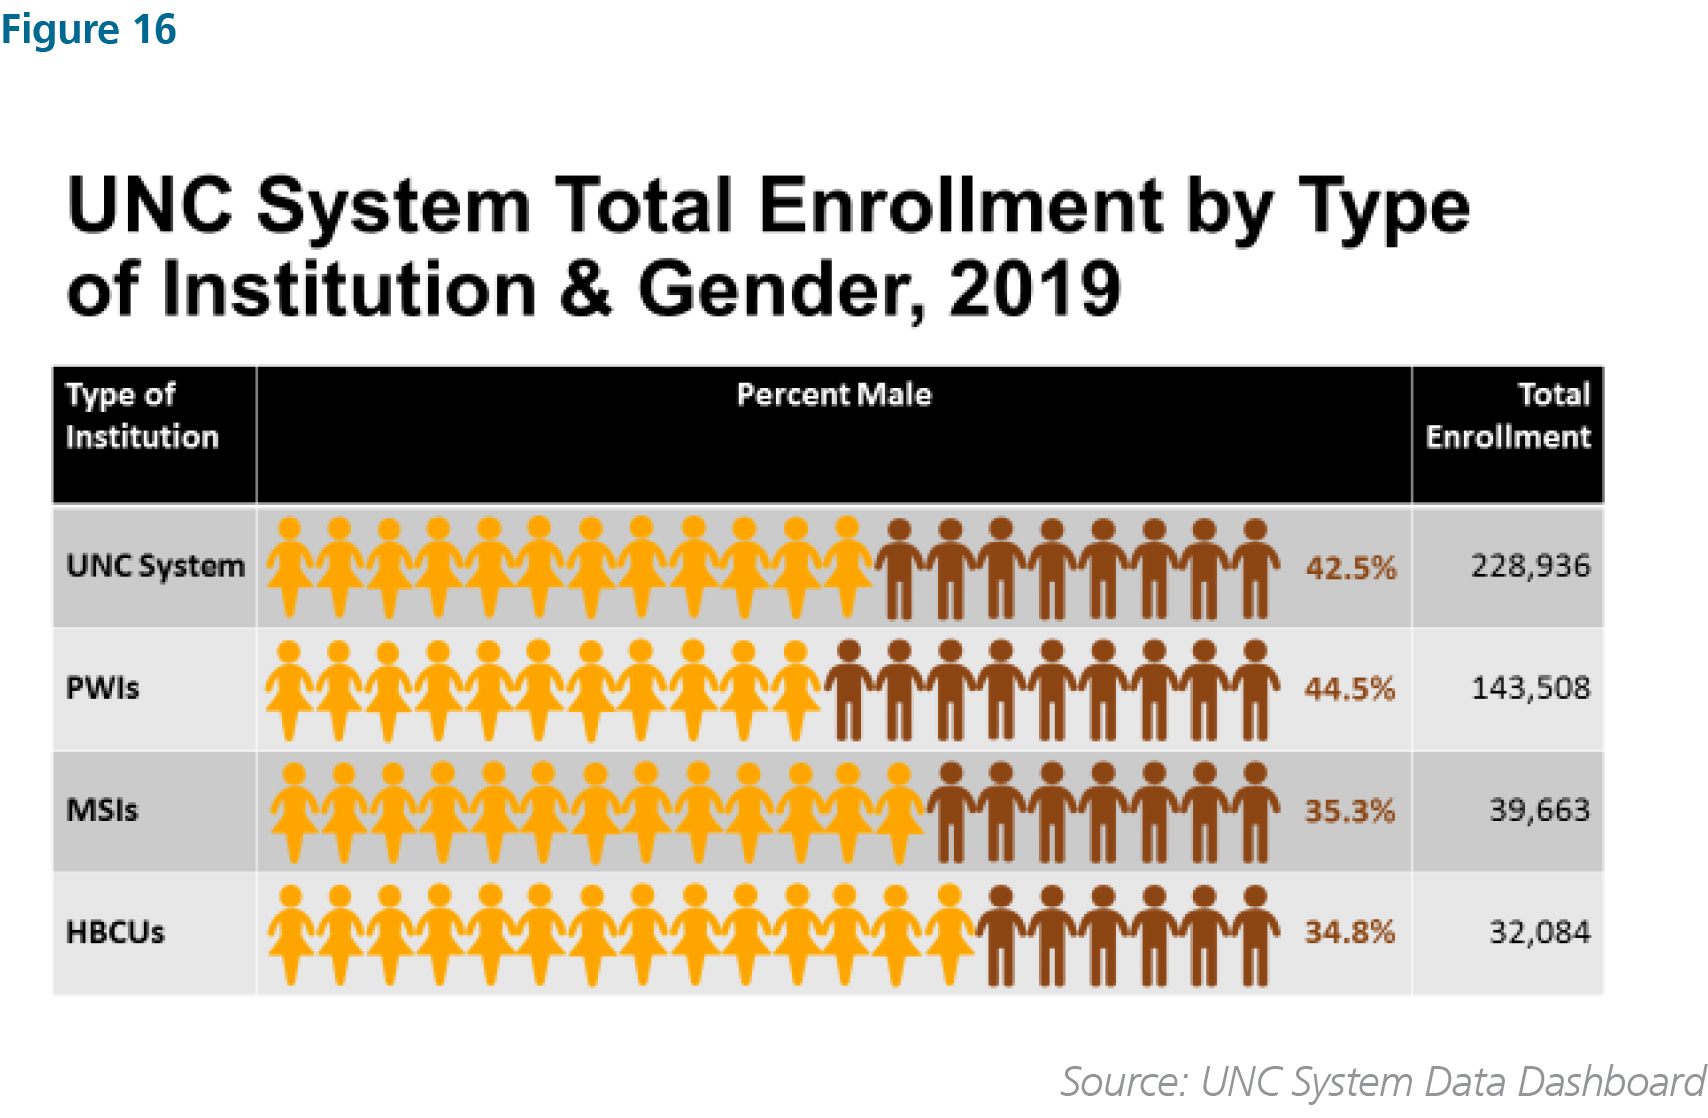
In the UNC system, American Indian and Black student enrollment was 37 percent and 36 percent male, respectively, in 2019 (Figure 15). Males were similarly under-represented in enrollment in the UNC System’s Minority Serving Institutions (MSIs) and Historically Black Colleges and Universities (HBCUs)—hovering around 35 percent on these campuses (Figure 16).
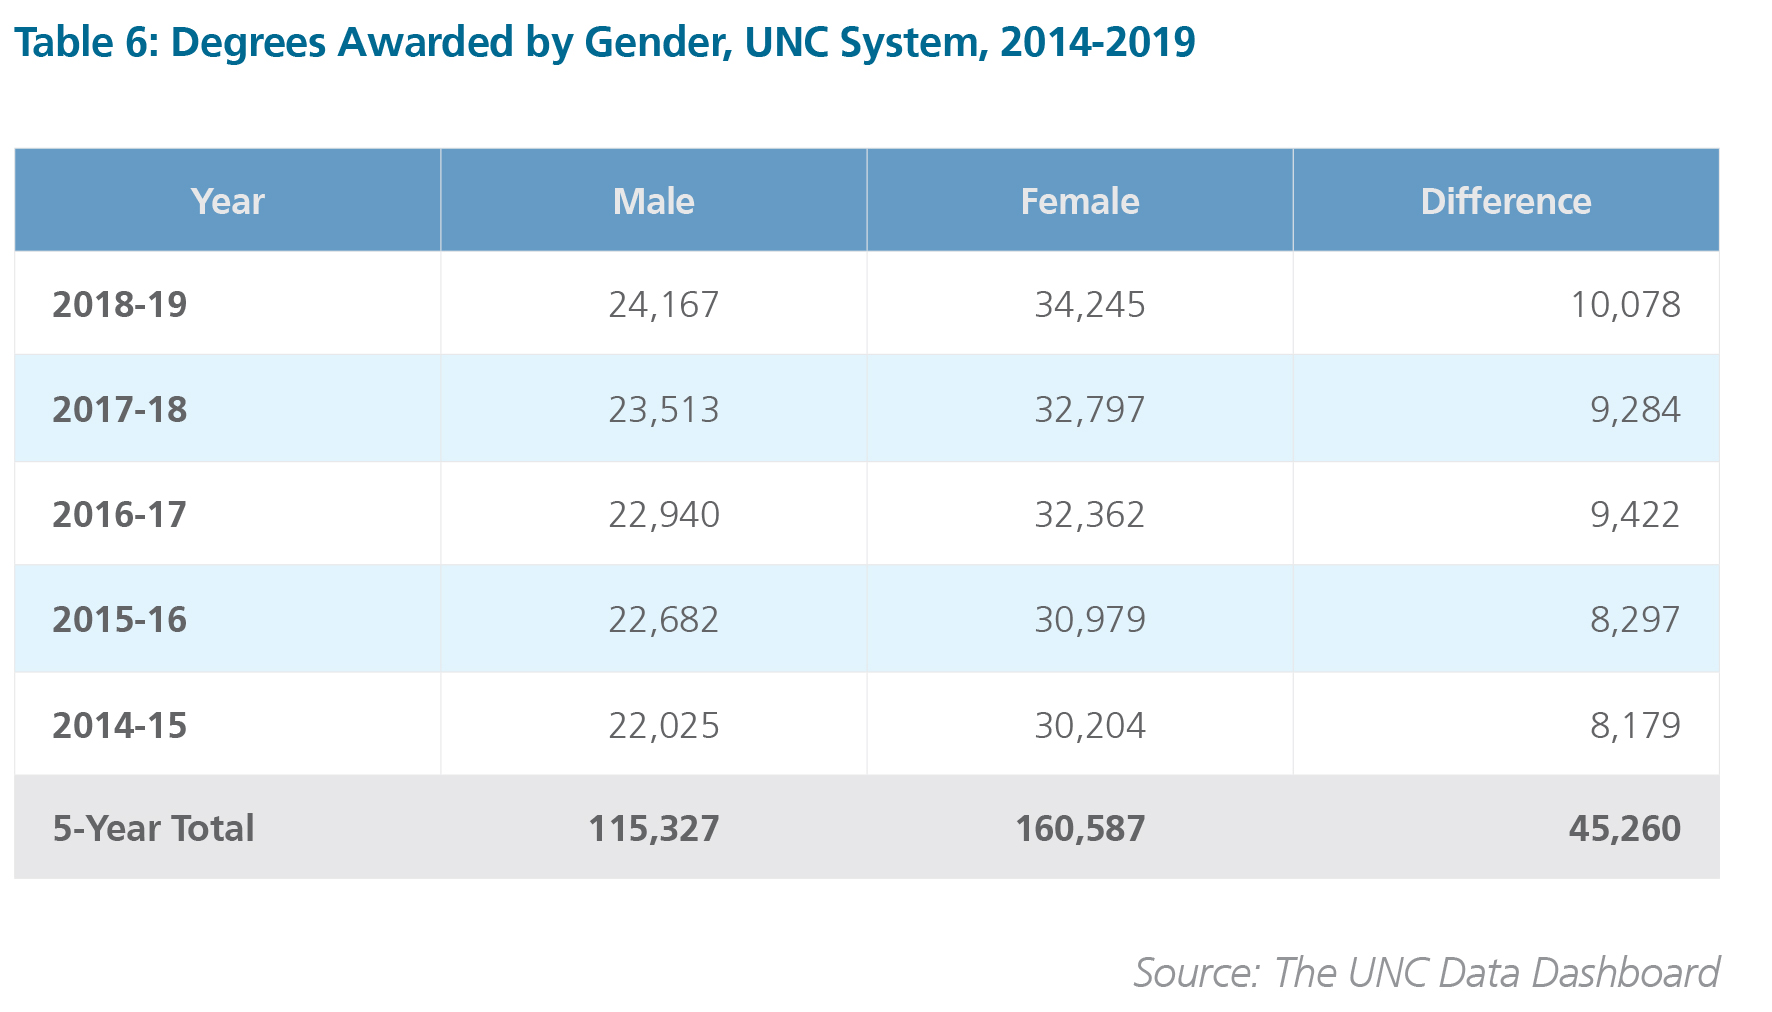
Predictably, the gender disparity in enrollment predisposed a similar disparity in degrees awarded in the UNC System. Over the 5-year period between 2014-15 and 2018-19, the system awarded 45,260 more degrees to women (160,587) than to men (115,327) (Table 6). During this period, 15,233 more degrees were awarded to black women (30,394) than black men (15,161) (Table 7).
The gender ratio imbalance in college enrollment and degrees awarded, which originates in the K-12 education and criminal justice systems’ disparate treatment of males of color, has enormous implications for marriage, family formation, and wealth accumulation in our state and the nation more generally. Simply put, due to gender disparities in higher education enrollment and graduation rates, the ratio of eligible marriageable males and eligible marriageable females is misaligned (Raspberry, 1985; Sawhill, 2015).
Moving forward, if the goal is to have stable, two-wage earner families and healthy communities that serve as crucibles for successful child development and wealth accumulation, we must devise strategies to address the so-called “wayward sons” problem in our state (Autor and Wasserman, 2013; Sherman, 2017; McBride, 2017). There are far too many black boys falling through the cracks of the K-12 education system, all too often ending up ensconced in the criminal justice system—the scarlet letter of un-employability (Cooper, 2018).
RECOMMENDED EQUITY & INCLUSION TOOLS
To address these geographic and demographic equity concerns, the state should develop a roadmap for inclusive and equitable development that:
- Offers incentives to encourage both primary and return migration to the state’s declining counties. Other states and communities are offering relocation expenses, tax credits, forgivable mortgages, student loan repayment, cash and land to attract talent (see Johnson, 2020). Given the pandemic-induced shift to remote work and the growing demand for more residential space to accommodate social distancing, this is the ideal time to purse such a strategy, especially if done in tandem with build out of broadband infrastructure. Research suggests that millennials with young children and individuals with aging family members in these counties might find such incentives attractive (Johnson, 2020).
- Embraces recent proposals to establish a place-based visa program under which visas would be granted to communities that are struggling economically (Ozimek, Fikri, and Lettieri, 2019). Under one such proposal, “communities could request immigrants with skills in certain fields and applicants would be eligible for a green card after three years if they stay in the community, five if they move” (Thompson and Gamboa, 2020; Kenny, 2020). Such a program would not only enhance population growth in declining counties; it also would help rural health care systems address their unmet demand for skilled health professionals and leverage the entrepreneurial acumen of immigrants to grow local businesses and create jobs in other economic sectors as well.
- Ensures that all development and redevelopment activities align to the maximum extent possible with the triple bottom line principles of sustainability; that is, does no harm to the environment and natural resources, adheres to principle of social justice and, in the process, returns equitable shareholder/stakeholder value.
- Pursues a ‘new” New deal style infrastructure development and redevelopment program that focuses on fixing not just roads, bridges, and broadband access issues. But, also, sick buildings—aging and structurally deteriorating houses, schools, and public venues that expose children and families to a host of environmental hazards (mold, mildew, asbestos, and lead) that suppress the immune system and create racially disparate vulnerabilities and outcomes to life-threatening events like the coronavirus pandemic (Johnson and Davis, 2020).
- Creates an inclusive supply chain management system that levels the playing field for historically underutilized businesses that aspire to access government contracts to fix deteriorating space and places in the state, especially in counties experiencing population decline (Johnson, 2019).
- Dismantles barriers to educational and economic participation that are the product of discriminatory policymaking, especially in the areas of crime and criminal justice, which disproportionately affect people of color in general, and black males in particular. Focus on eliminating barriers to occupational licensing, banning employment credit checks, expunging and sealing criminal records, driving privilege restoration, and abolishing Black and ethnic names discrimination in employment.
- Creates a mental wellness program for the population experiencing demographic depression.
- Continues to lobby for Medicaid expansion.
- Explores inclusionary zoning as a means to eliminate hyper-segregation and concentrated poverty (Tuller, 2018).
- Leverages social impact investing and the diverse set of financial tools to fund these initiatives, including federal, state, local, philanthropic, and private sources of capital— traditional as well as new sources that are emerging in response to the pandemic and the Black Lives Matter protest movement (Johnson and Bonds, 2020b).
If we utilize these tools and pursue these strategies with dogged tenacity, the state of North Carolina can become the envy of the nation as the place to live, work, play, and do business — a place where equity, inclusion, and belonging are the new normal.
The Kenan Institute serves as a national center for scholarly research, joint exploration of issues, and course development with the principal theme of preservation, encouragement, and understanding of private enterprise.
Autor, David and Wasserman, Melanie, 2013, Wayward Sons: The Emerging Gender Gap in Labor Markets and Education, Third Way Report, March 20, available at https://www.thirdway.org/report/wayward-sons-the-emerging-gender-gap-in-labor-markets-and-education.
Case, Ann and Deaton, Angus, 2020, Deaths of Despair and the Future of Capitalism, Princeton University Press, available at https://press.princeton.edu/books/hardcover/9780691190785/deaths-of-despair-and-the-future-of-capitalism.
Chira, Susan, 2016a, “Men Need Help: Is Hillary Clinton the Answer?,” The New York Times, October 21, available at https://www.nytimes.com/2016/10/23/opinion/campaign-stops/men-need-help-is-hillary-clinton-the-answer.html.
Chira, Susan, 2016b, The Crisis of Men in America,” The New York Times, October 25, available at https://www.nytimes.com/2016/10/25/opinion/the-crisis-of-men-in-america.html.
Cooper, Ryan, 2018, “The Plight of Black Men,” The Week, March 22, available at https://theweek.com/articles/761951/plight-black-men.
Ellison, Ayla, 2018, “State by State Breakdown of 83 Rural Hospital Closures,” Becker’s Hospital Review E-Weekly, January 26, available at https://www.beckershospitalreview.com/finance/state-by-state-breakdown-of-83-rural-hospital-closures.html
Freedman, V. and Spillman, B., 2016, Active Life Expectancy in the Older U.S. Population, 1982-20111: Differences Between Blacks and Whites Persisted,” Health Affairs, 35, 1351-1358.
Graham, Carol, 2017, Happiness for All? Unequal Hopes and Lives in Pursuit of the American Dream. Princeton University Press, available at https://press.princeton.edu/books/hardcover/9780691169460/happiness-for-all
Gujral, Kritee and Basu, Anirban, 2019, “Impact of Rural and Urban Hospital Closures on Inpatient Mortality,” NBER Working Paper Series, Working paper 26182, August, available at https://www.nber.org/papers/w26182.pdf
Johnson, James H., Jr. and Bonds, Jeanne Milliken, 2020a, ‘Scapegoating Immigrants in the COVID-19 Pandemic, Frank Hawkins Kenan Institute of Private Enterprise White Paper, August 18, available at https://uisc.unc.edu/index.php/research/ki-research/?researchID=12063&researchID=12063
Johnson, James H., Jr. and Bonds, Jeanne Milliken, 2020b, “Leading, Managing and Communicating in an Era of Certain Uncertainty,” Frank Hawkins Kenan Institute of Private Enterprise White Paper, August 18, available at https://uisc.unc.edu/index.php/research/ki-research/?researchID=12066&researchID=12066
Johnson, James H., Jr., 2020, “Coronavirus Pandemic Refugees and the Future of American Cities,” Frank Hawkins Kenan Institute of Private Enterprise White Paper, August 18, available at https://kenaninstitute.unc.edu/publication/coronavirus-pandemic-refugees-and-the-future-of-american-cities/
Johnson, James H., Jr., 2020, “African American Working Poor Need ‘Strategic Response” WRAL TechWire, May 26, available https://www.wraltechwire.com/2020/05/26/african-american-working-poor-need-strategic-response-kenan-flagler-expert/
Johnson, James H., Jr. and Davis, Wendell M., 2020, “Needed – A new ‘New Deal’ in America,” Triangle Business Journal, April 24, available at https://www.bizjournals.com/triangle/news/2020/04/24/column-needed-a-new-new-deal-in-america.html
Johnson, James H., Jr., 2019, “Business Intelligence for Creating an Inclusive Model of Contracting and Procurement for the City of Durham,” Frank Hawkins Kenan Institute of Private Enterprise White Paper, September 1, available at https://kenaninstitute.unc.edu/publication/business-intelligence-for-creating-an-inclusive-model-of-contracting-and-procurement-in-the-city-of-durham/
Johnson, James H., Jr. and Parnell, Allan M., 2019, “Seismic Shifts,” Business Officer, July/August, available at https://businessofficermagazine.org/features/seismic-shifts/
Johnson, James H., Jr.. Parnell, Allan M., and Lian, Huan, 2019, “America’s Shifting Demographic Landscape: Implications for Higher Education,” April, Frank Hawkins Kenan Institute of Private Enterprise Report, available at https://www.ecs.org/wp-content/uploads/DisruptiveDemographics_06102019_reduced-003.pdf
Johnson, James H., Jr., McDaniel M., and Parnell, A. M., 22019, “Built2Last: A Roadmap for Inclusive and Equitable Development in Durham,” Frank Hawkins Kenan Institute of Private Enterprise White Paper, April 1, available at https://kenaninstitute.unc.edu/publication/built2last-a-roadmap-for-inclusive-and-equitable-development-in-durham/
Johnson, James H., Jr. and Parnell, Allan M., 2016, “The Challenges and Opportunities of the American Demographic Shift,” Generations, Vol. 40, Winter, available at https://www.questia.com/library/ journal/1P3-4312985081/the-challenges-and-opportunities-of-the-american-demographic
Johnson, James H., Jr. and Lian, Huan, 2018, “Vulnerable African American Seniors: The Challenges of Aging in Place,” Journal of Housing for the Elderly, Vol 32, available at https://www.tandfonline.com/doi/abs/10.1080/02763 893.2018.1431581
Johnson, James H., Jr., et. al., 2016 “Disruptive Demographics: The Triple Whammy of Geographic Disadvantage and the Future of K-12 Education in America,” Chapter 5 in Leading Schools in Challenging Times: Eye to the Future, edited by Bruce Anthony Jones and Anthony Rolle, Information Age Publishing, pp. 115-156.
Kaiser Family Foundation, 2020, Status of State Medicaid Expansion Decisions: Interactive Map, February 19, available at https://www.kff.org/medicaid/issue-brief/status-of-state-medicaid-expansion-decisions-interactive-map/
Karma, Roge, 2020, “Deaths of Despair: The Deadly Epidemic that Predated Coronavirus,” Vox, April 15, available at https://www.vox.com/2020/4/15/21214734/deaths-of-despair-coronavirus-covid-19-angus-deaton-anne-case-americans-deaths
Kenny, Caroline, 2020, “Michael Bloomberg Unveils Immigration Plan Including Place-Based Visa,” CNN Politics, February 10, available https://www.cnn.com/2020/02/10/politics/michael-bloomberg-immigration-plan/index.html
Koller, Christopher F., 2019, “Deaths of Despair”: A Cultural, Not Clinical, Challenge,” Millbank Memorial Fund, January 28, available at https://www.milbank.org/2019/01/deaths-of-despair-prevention-for-a-growing-crisis/?gcli d=Cj0KCQiAtOjyBRC0ARIsAIpJyGN_Dx9lBk0tDwRstWD5-LspNTTvGgqsCDHQrSwD_20b6tTCqsVGzSYaAhKyEA Lw_wcB
Kristof, Nicholas, 2020, “The Hidden Depression Trump Isn’t Helping,” The New York Times, February 8, available at https://www.nytimes.com/2020/02/08/opinion/sunday/trump-economy.html
Luhby, Tami, 2015, “Working, But Still Poor,” CNN Business, May 11, available at https://money.cnn.com/2015/05/07/news/economy/working-poor/index.html
Lukas, Carrie, 2016, “Don’t Let Political Correctness Blind us to the Plight of Young Men,” HUFFPOST, June 4, available at https://www.huffpost.com/entry/dont-let-political-correc_b_10281196
MacGillis, Alec and ProPublica, 2016, “The Original Underclass,” The Atlantic, September, available at https://soundcloud.com/user-154380542/the-original-underclass-alec-mcgillis-and-propublica-the-atlantic-magazine
McBride, Lisa, 2017, “Changing the Narrative for Men of Color in Higher Education,” Insight Into Diversity, May 24, available at https://www.insightintodiversity.com/changing-the-narrative-for-men-of-color-in-higher-education/
Miller, Katherine E. M., et al., 2020, “The Effect of Rural Hospital Closures on Emergency Medical Service Response and Transport Times,” Health Services Research, January, available at https://onlinelibrary.wiley.com/doi/ full/10.1111/1475-6773.13254
Morin, Amy, 2018, Loneliness Is as Lethal As Smoking 15 Cigarettes Per Day. Here’s What You Can Do About It,” Inc.com, June 18, available at https://www.inc.com/amy-morin/americas-loneliness-epidemic-is-more-lethal-than-smoking-heres-what-you-can-do-to-combat-isolation.html
Ozimek, Adam, Fikri, Kenan, and Lettieri, John, 2019, From Managing Decline to Building the Future: Could A Heartland Visa Help Struggling Regions?, Economic Innovations Group, April, available at https://eig.org/wp-content/uploads/2019/04/Heartland-Visas-Report.pdf
Raspberry, William, 1985, “The Men Aren’t There To Marry,” Washington Post, May 8, available at https://www.washingtonpost.com/archive/politics/1985/05/08/the-men-arent-there-to-marry/480cfbc7-3ff2-46f8-8a5f-54d4bf18100d/
Sawhill, Isabel V., 2015, “Is There A Shortage of Marriageable Men?,” Bookings Social Mobility Memos, September 22, available at https://www.brookings.edu/blog/social-mobility-memos/2015/09/22/is-there-a-shortage-of-marriageable-men/
Sherman, Mark, 2017, “The Young American Male: A Shameful Chronology of Neglect,” Psychology Today, August 21, available at https://www.psychologytoday.com/us/blog/real-men-dont-write-blogs/201708/the-young-american-male-shameful-chronology-neglect
Tuller, David, 2018, Housing and Health: The Role of Inclusionary Zoning,” Health Affairs, June 7, available at https://www.healthaffairs.org/do/10.1377/hpb20180313.668759/full/
Related Articles
Business Alert! Gale Force Demographic Wind Gusts Ahead
Seven powerful demographic trends—analogous to gale force wind gusts in an adverse weather event—constitute potentially powerful disruptors of business and commerce in the years ahead. Four of the gale force demographic disruptors—slowing total and foreign-born population growth, white population loss, and declining fertility— have evolved over the past several decades.
Prioritize High-Risk Demographics in Vaccine Rollout
The pandemic is having a compounded effect of communities of color. Already over-represented relative to their shares of the total population in coronavirus infections, hospitalizations, and deaths, people of color also have a higher likelihood of living in over-crowded multi-generational households than are Whites.
CORONAVIRUS VACCINE DISTRIBUTION: A Race Blind Approach to a Racially Disparate Problem?
Considerable scholarly analysis and media attention has documented the racially disparate impact of coronavirus infections, hospitalizations, and deaths. Constituting 13 percent of the general population, Blacks reportedly account for 25 percent of those that have tested positive and 39 percent of the COVID-related deaths in the United States.


